Advertisement
- United States
- /
- Electrical
- /
- NYSE:VRT
Is Now the Right Time to Reassess Vertiv After Its Shares Jumped 63% This Year?

Simply Wall St
Reviewed by Bailey Pemberton
If you have been following Vertiv Holdings Co, you have probably found yourself wondering whether to get on board, add to your position, or simply watch from the sidelines. With a share price that closed at $175.15 recently, Vertiv’s story is one that demands a closer look, and investors deciding what to do next are certainly not alone. In just the last week, the stock is up 10.2%. If you zoom out further, the momentum gets even more impressive: climbing 29.9% over the last month, 48.1% for the year to date, and a whopping 63.2% over the past year. Stretch back three years and the headline becomes even more eye-catching: Vertiv shares have skyrocketed 1,431.1%. The five-year return is an astonishing 850.5%.
Some of this surge reflects big-picture market developments, particularly increased demand for data center infrastructure and energy-efficient solutions. As the world doubles down on digital transformation and AI-driven growth, Vertiv has found itself in a prime position to benefit from these industry shifts. However, rapid price appreciation often brings new questions about valuation and whether the run has outpaced fundamentals.
That leads us to an important reality check. Vertiv’s value score currently stands at zero, meaning it does not qualify as undervalued for any of the six key metrics we track. Before making your next move, let’s break down the traditional valuation approaches used to assess Vertiv’s stock. Just as importantly, stick around as we explore a more holistic way to judge whether the price is right.
Vertiv Holdings Co scores just 0/6 on our valuation checks. See what other red flags we found in the full valuation breakdown.
Approach 1: Vertiv Holdings Co Discounted Cash Flow (DCF) Analysis
The Discounted Cash Flow (DCF) model is a fundamental approach to valuation that estimates a company’s intrinsic value by forecasting its future cash flows and discounting them back to their present value using a required rate of return. This helps investors gauge how much the company should be worth today based on its ability to generate cash in the coming years.
For Vertiv Holdings Co, the latest reported Free Cash Flow stands at $1.24 billion. Analyst estimates project strong annual growth in cash flow, with forecasts rising to $3.08 billion by the end of 2029. While analyst consensus guides the first five years of these projections, the years beyond rely on trend-based extrapolations. Over the next decade, the growth in Free Cash Flow suggests optimism about Vertiv’s ongoing role in supporting digital infrastructure and data expansion.
Despite this robust outlook, the DCF model values Vertiv at an intrinsic price of $136.72 per share. With the current share price at $175.15, Vertiv trades at a premium of about 28.1 percent above its estimated fair value. This suggests that the stock, at current levels, is overvalued based on projected future cash flows.
Result: OVERVALUED
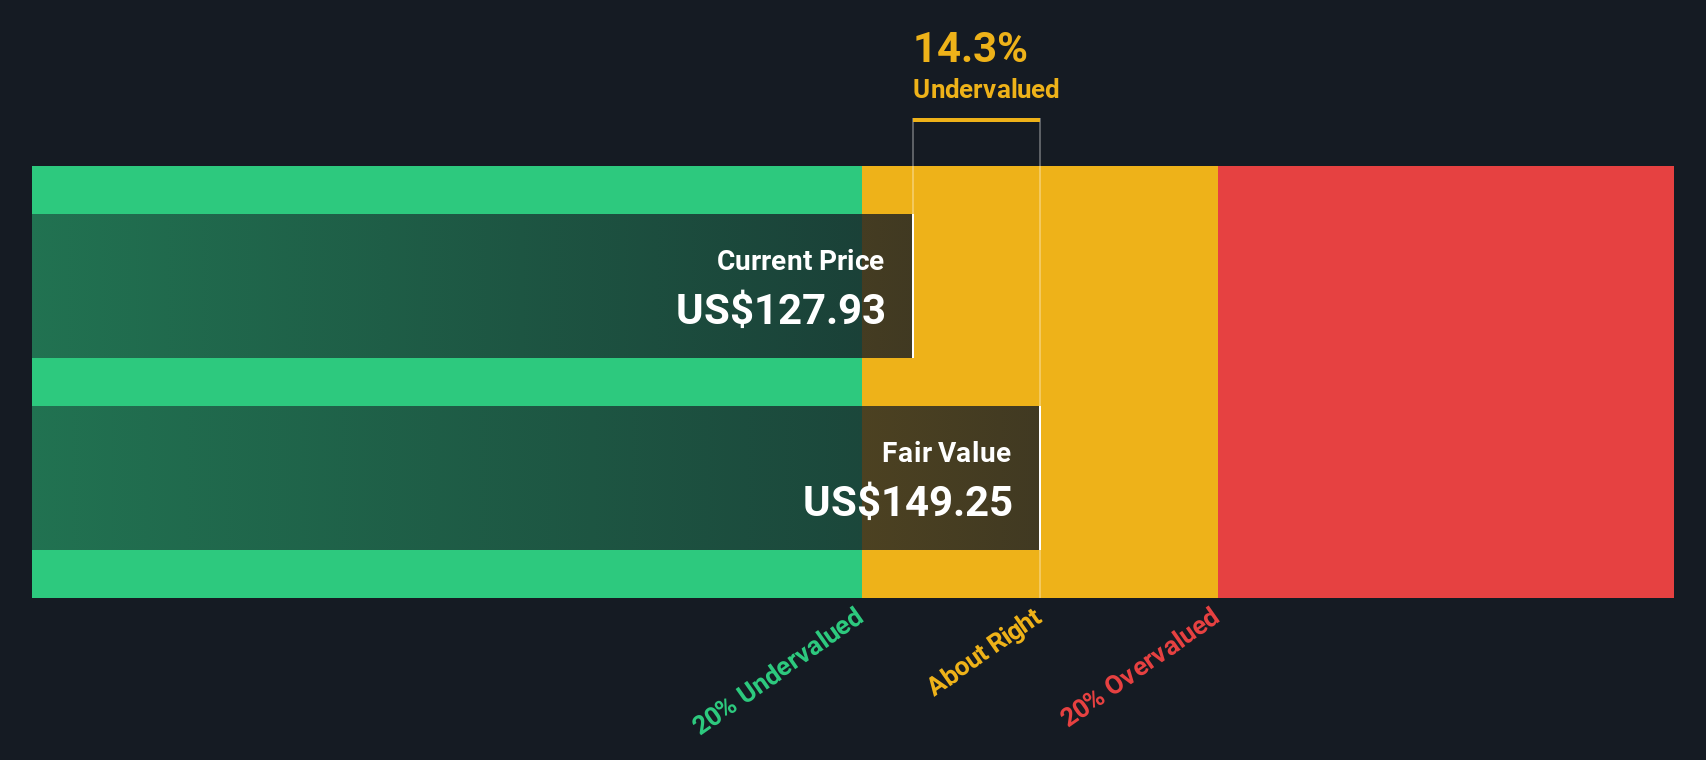
Our Discounted Cash Flow (DCF) analysis suggests Vertiv Holdings Co may be overvalued by 28.1%. Find undervalued stocks or create your own screener to find better value opportunities.
Approach 2: Vertiv Holdings Co Price vs Earnings
For established, profitable companies like Vertiv Holdings Co, the Price-to-Earnings (PE) ratio is a widely used valuation metric because it directly connects the company’s share price to its earnings. It helps investors understand how much they are paying for each dollar of profit, making it a straightforward gauge of market expectations versus actual business performance.
The “right” PE ratio for any company depends on factors like growth prospects and risk. A company with strong expected earnings growth or a dominant industry position often commands a higher PE, while heightened risks can pull the ratio lower. Vertiv’s current PE ratio stands at 82.34x, which is considerably higher than both the industry average of 29.88x and the peer average of 35.02x for the electrical sector.
Simply Wall St’s proprietary Fair Ratio considers Vertiv’s unique mix of factors, including its earnings growth outlook, profitability, industry dynamics, and market size. Unlike simple peer or industry comparisons, the Fair Ratio provides a holistic benchmark that reflects not just how Vertiv stacks up in its sector but also how its individual strengths and risks justify a higher or lower valuation. For Vertiv, the Fair Ratio is 65.61x, signaling the level at which investors should expect the stock to trade based on its specific fundamentals.
Comparing the Fair Ratio of 65.61x with the actual PE of 82.34x, Vertiv’s stock appears to be priced well above what would be justified by its underlying prospects and sector context.
Result: OVERVALUED
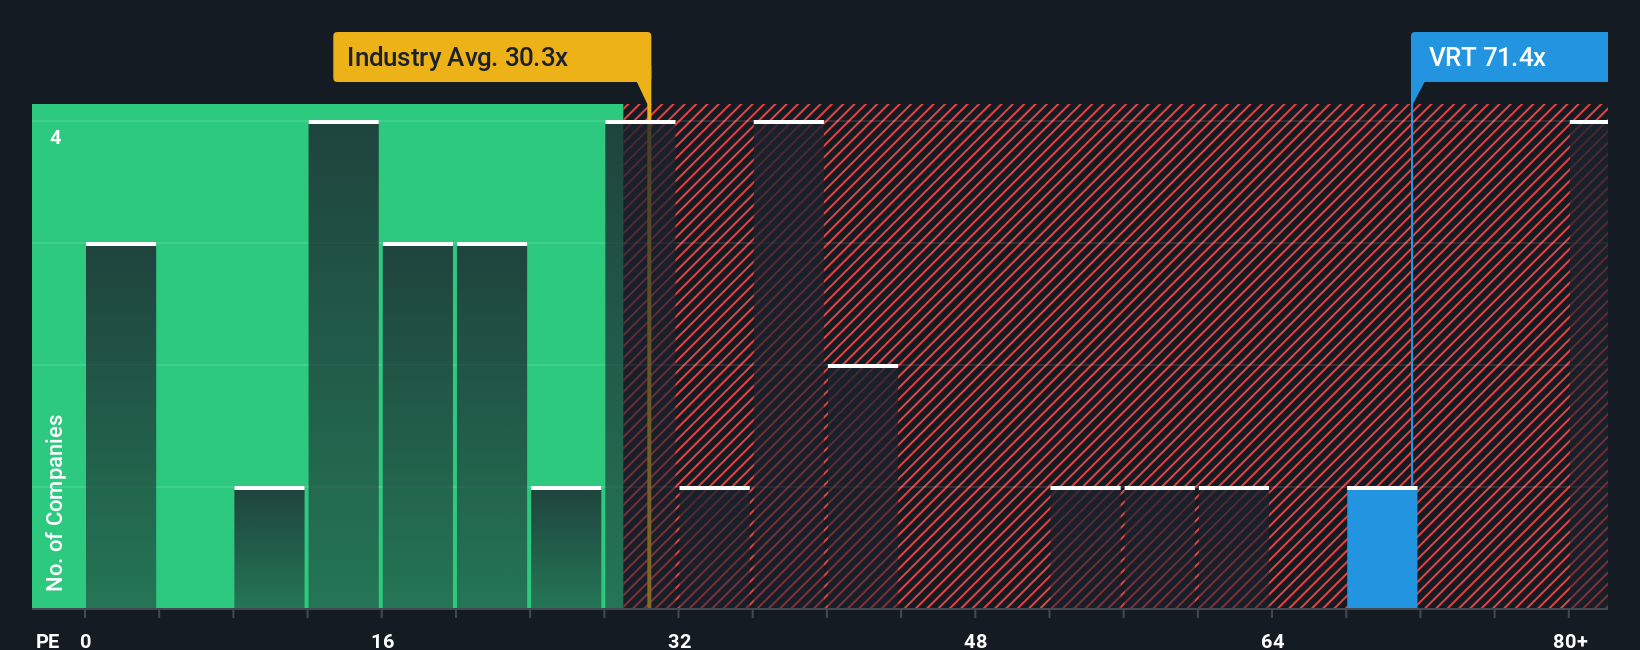
PE ratios tell one story, but what if the real opportunity lies elsewhere? Discover companies where insiders are betting big on explosive growth.
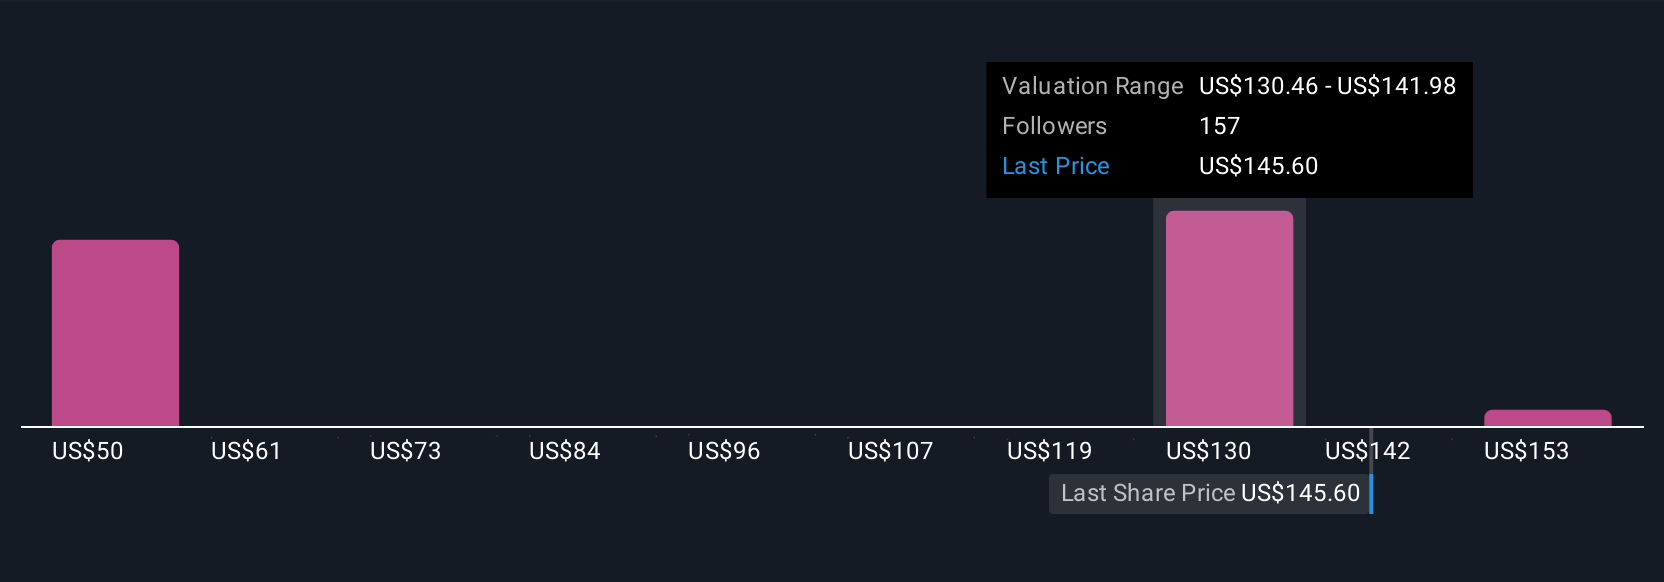
Upgrade Your Decision Making: Choose your Vertiv Holdings Co Narrative
Earlier, we mentioned there is an even better way to understand valuation. Let’s introduce you to Narratives, a smarter, more dynamic tool for making investment decisions. A Narrative is a simple, accessible way for investors like you to define the story you believe about a company, from your outlook on future revenue and margins to what you consider a fair price. This connects these assumptions directly to a financial forecast and fair value.
Narratives bridge the gap between the numbers and the reasons behind them, helping you anchor your buy or sell decisions in evidence and context rather than guesses or headlines. On Simply Wall St’s Community page, millions of investors use Narratives to share, refine, and update their perspectives as new information arrives, whether it’s earnings results, regulatory news, or shifts in the industry climate. Narratives automatically refresh to reflect these updates, ensuring your analysis stays current and relevant.
For example, with Vertiv Holdings Co, some investors’ Narratives expect global AI demand and favorable policies will keep boosting data center growth, supporting higher price targets like $173.0. Others remain cautious about margin risks and see a fair price closer to $119.0. By comparing these Narrative-driven fair values with Vertiv’s current price, you get a clear, evolving view of opportunities and risks, grounded in real investor outlooks rather than static ratios.
Do you think there's more to the story for Vertiv Holdings Co? Create your own Narrative to let the Community know!
This article by Simply Wall St is general in nature. We provide commentary based on historical data and analyst forecasts only using an unbiased methodology and our articles are not intended to be financial advice. It does not constitute a recommendation to buy or sell any stock, and does not take account of your objectives, or your financial situation. We aim to bring you long-term focused analysis driven by fundamental data. Note that our analysis may not factor in the latest price-sensitive company announcements or qualitative material. Simply Wall St has no position in any stocks mentioned.
New: Manage All Your Stock Portfolios in One Place
We've created the ultimate portfolio companion for stock investors, and it's free.
• Connect an unlimited number of Portfolios and see your total in one currency
• Be alerted to new Warning Signs or Risks via email or mobile
• Track the Fair Value of your stocks
Have feedback on this article? Concerned about the content? Get in touch with us directly. Alternatively, email editorial-team@simplywallst.com
About NYSE:VRT
Vertiv Holdings Co
Designs, manufactures, and services critical digital infrastructure technologies and life cycle services for data centers, communication networks, and commercial and industrial environments in the Americas, the Asia Pacific, Europe, the Middle East, and Africa.
Flawless balance sheet with high growth potential.
Similar Companies
Market Insights

Advertisement
Community Narratives
A formidable player in AI and enterprise computing.
Fair Value US$210.00|3.9% overvalued
CO
Community Contributor
IREN's Bold Moves in Sustainable Bitcoin Mining & AI Data Centers
Fair Value US$89.00|21.8% undervalued
BL
Community Contributor
Cooling the Champions: The Aussie Tech Behind F1's Victories
Fair Value AU$12.40|40.6% undervalued
TR
Community Contributor