
Advertisement
- United States
- /
- Aerospace & Defense
- /
- NYSE:TXT
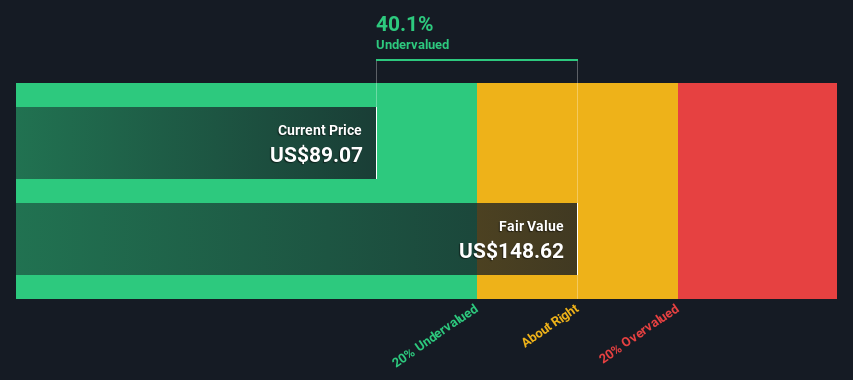
Is There An Opportunity With Textron Inc.'s (NYSE:TXT) 40% Undervaluation?
Key Insights
- The projected fair value for Textron is US$149 based on 2 Stage Free Cash Flow to Equity
- Textron is estimated to be 40% undervalued based on current share price of US$89.07
- Our fair value estimate is 60% higher than Textron's analyst price target of US$92.77
Today we'll do a simple run through of a valuation method used to estimate the attractiveness of Textron Inc. (NYSE:TXT) as an investment opportunity by projecting its future cash flows and then discounting them to today's value. This will be done using the Discounted Cash Flow (DCF) model. It may sound complicated, but actually it is quite simple!
Remember though, that there are many ways to estimate a company's value, and a DCF is just one method. If you still have some burning questions about this type of valuation, take a look at the Simply Wall St analysis model.
View our latest analysis for Textron
The Method
We use what is known as a 2-stage model, which simply means we have two different periods of growth rates for the company's cash flows. Generally the first stage is higher growth, and the second stage is a lower growth phase. To begin with, we have to get estimates of the next ten years of cash flows. Where possible we use analyst estimates, but when these aren't available we extrapolate the previous free cash flow (FCF) from the last estimate or reported value. We assume companies with shrinking free cash flow will slow their rate of shrinkage, and that companies with growing free cash flow will see their growth rate slow, over this period. We do this to reflect that growth tends to slow more in the early years than it does in later years.
A DCF is all about the idea that a dollar in the future is less valuable than a dollar today, and so the sum of these future cash flows is then discounted to today's value:
10-year free cash flow (FCF) forecast
| 2024 | 2025 | 2026 | 2027 | 2028 | 2029 | 2030 | 2031 | 2032 | 2033 | |
| Levered FCF ($, Millions) | US$932.0m | US$1.06b | US$1.16b | US$1.20b | US$1.22b | US$1.24b | US$1.27b | US$1.29b | US$1.32b | US$1.35b |
| Growth Rate Estimate Source | Analyst x9 | Analyst x9 | Analyst x6 | Analyst x3 | Analyst x1 | Est @ 1.75% | Est @ 1.91% | Est @ 2.03% | Est @ 2.10% | Est @ 2.16% |
| Present Value ($, Millions) Discounted @ 6.1% | US$878 | US$939 | US$973 | US$947 | US$907 | US$870 | US$836 | US$804 | US$773 | US$745 |
("Est" = FCF growth rate estimated by Simply Wall St)
Present Value of 10-year Cash Flow (PVCF) = US$8.7b
We now need to calculate the Terminal Value, which accounts for all the future cash flows after this ten year period. The Gordon Growth formula is used to calculate Terminal Value at a future annual growth rate equal to the 5-year average of the 10-year government bond yield of 2.3%. We discount the terminal cash flows to today's value at a cost of equity of 6.1%.
Terminal Value (TV)= FCF2033 × (1 + g) ÷ (r – g) = US$1.3b× (1 + 2.3%) ÷ (6.1%– 2.3%) = US$36b
Present Value of Terminal Value (PVTV)= TV / (1 + r)10= US$36b÷ ( 1 + 6.1%)10= US$20b
The total value, or equity value, is then the sum of the present value of the future cash flows, which in this case is US$29b. To get the intrinsic value per share, we divide this by the total number of shares outstanding. Relative to the current share price of US$89.1, the company appears quite good value at a 40% discount to where the stock price trades currently. Remember though, that this is just an approximate valuation, and like any complex formula - garbage in, garbage out.
Important Assumptions
Now the most important inputs to a discounted cash flow are the discount rate, and of course, the actual cash flows. Part of investing is coming up with your own evaluation of a company's future performance, so try the calculation yourself and check your own assumptions. The DCF also does not consider the possible cyclicality of an industry, or a company's future capital requirements, so it does not give a full picture of a company's potential performance. Given that we are looking at Textron as potential shareholders, the cost of equity is used as the discount rate, rather than the cost of capital (or weighted average cost of capital, WACC) which accounts for debt. In this calculation we've used 6.1%, which is based on a levered beta of 0.828. Beta is a measure of a stock's volatility, compared to the market as a whole. We get our beta from the industry average beta of globally comparable companies, with an imposed limit between 0.8 and 2.0, which is a reasonable range for a stable business.
SWOT Analysis for Textron
Strength
- Earnings growth over the past year exceeded its 5-year average.
- Debt is not viewed as a risk.
Weakness
- Earnings growth over the past year underperformed the Aerospace & Defense industry.
- Dividend is low compared to the top 25% of dividend payers in the Aerospace & Defense market.
Opportunity
- Annual earnings are forecast to grow for the next 3 years.
- Good value based on P/E ratio and estimated fair value.
Threat
- Annual earnings are forecast to grow slower than the American market.
Next Steps:
Valuation is only one side of the coin in terms of building your investment thesis, and it ideally won't be the sole piece of analysis you scrutinize for a company. It's not possible to obtain a foolproof valuation with a DCF model. Instead the best use for a DCF model is to test certain assumptions and theories to see if they would lead to the company being undervalued or overvalued. If a company grows at a different rate, or if its cost of equity or risk free rate changes sharply, the output can look very different. Why is the intrinsic value higher than the current share price? For Textron, we've compiled three pertinent factors you should further research:
- Financial Health: Does TXT have a healthy balance sheet? Take a look at our free balance sheet analysis with six simple checks on key factors like leverage and risk.
- Future Earnings: How does TXT's growth rate compare to its peers and the wider market? Dig deeper into the analyst consensus number for the upcoming years by interacting with our free analyst growth expectation chart.
- Other Solid Businesses: Low debt, high returns on equity and good past performance are fundamental to a strong business. Why not explore our interactive list of stocks with solid business fundamentals to see if there are other companies you may not have considered!
PS. The Simply Wall St app conducts a discounted cash flow valuation for every stock on the NYSE every day. If you want to find the calculation for other stocks just search here.
Valuation is complex, but we're here to simplify it.
Discover if Textron might be undervalued or overvalued with our detailed analysis, featuring fair value estimates, potential risks, dividends, insider trades, and its financial condition.
Access Free AnalysisHave feedback on this article? Concerned about the content? Get in touch with us directly. Alternatively, email editorial-team (at) simplywallst.com.
This article by Simply Wall St is general in nature. We provide commentary based on historical data and analyst forecasts only using an unbiased methodology and our articles are not intended to be financial advice. It does not constitute a recommendation to buy or sell any stock, and does not take account of your objectives, or your financial situation. We aim to bring you long-term focused analysis driven by fundamental data. Note that our analysis may not factor in the latest price-sensitive company announcements or qualitative material. Simply Wall St has no position in any stocks mentioned.
About NYSE:TXT
Textron
Operates in the aircraft, defense, industrial, and finance businesses worldwide.
Flawless balance sheet and undervalued.
Similar Companies
Market Insights

Advertisement
Community Narratives
A formidable player in AI and enterprise computing.
Fair Value US$210.00|0.7% overvalued
CO
Community Contributor
IREN's Bold Moves in Sustainable Bitcoin Mining & AI Data Centers
Fair Value US$72.52|14.9% undervalued
BL
Community Contributor
Cooling the Champions: The Aussie Tech Behind F1's Victories
Fair Value AU$12.40|38.1% undervalued
TR
Community Contributor