
Advertisement

Legendary fund manager Li Lu (who Charlie Munger backed) once said, 'The biggest investment risk is not the volatility of prices, but whether you will suffer a permanent loss of capital. It's only natural to consider a company's balance sheet when you examine how risky it is, since debt is often involved when a business collapses. We note that Trinity Industries, Inc. (NYSE:TRN) does have debt on its balance sheet. But the real question is whether this debt is making the company risky.
When Is Debt A Problem?
Debt is a tool to help businesses grow, but if a business is incapable of paying off its lenders, then it exists at their mercy. In the worst case scenario, a company can go bankrupt if it cannot pay its creditors. However, a more common (but still painful) scenario is that it has to raise new equity capital at a low price, thus permanently diluting shareholders. Of course, the upside of debt is that it often represents cheap capital, especially when it replaces dilution in a company with the ability to reinvest at high rates of return. When we think about a company's use of debt, we first look at cash and debt together.
View our latest analysis for Trinity Industries
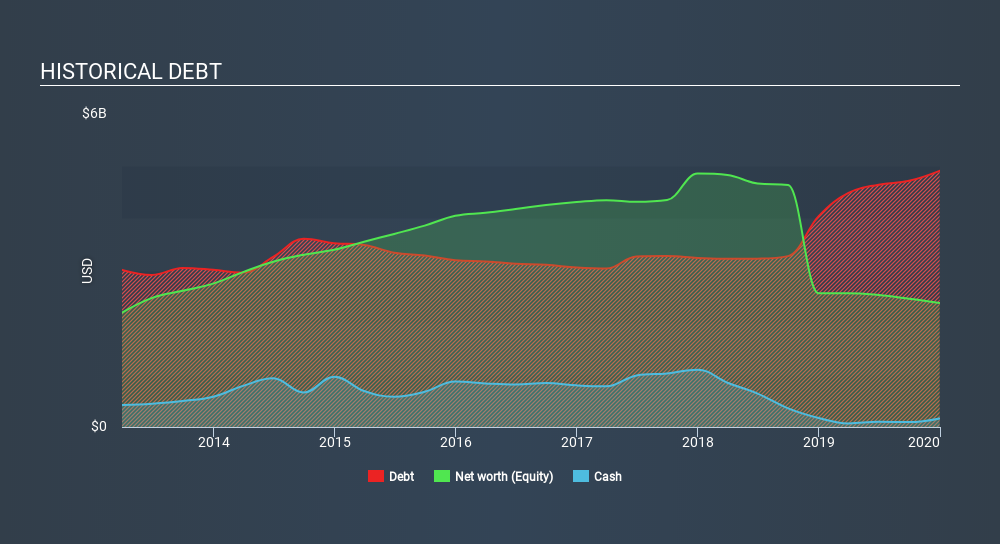
What Is Trinity Industries's Debt?
You can click the graphic below for the historical numbers, but it shows that as of December 2019 Trinity Industries had US$4.91b of debt, an increase on US$4.04b, over one year. On the flip side, it has US$164.4m in cash leading to net debt of about US$4.75b.
How Healthy Is Trinity Industries's Balance Sheet?
We can see from the most recent balance sheet that Trinity Industries had liabilities of US$560.0m falling due within a year, and liabilities of US$5.76b due beyond that. Offsetting this, it had US$164.4m in cash and US$274.8m in receivables that were due within 12 months. So its liabilities outweigh the sum of its cash and (near-term) receivables by US$5.88b.
The deficiency here weighs heavily on the US$1.94b company itself, as if a child were struggling under the weight of an enormous back-pack full of books, his sports gear, and a trumpet. So we'd watch its balance sheet closely, without a doubt. After all, Trinity Industries would likely require a major re-capitalisation if it had to pay its creditors today.
We use two main ratios to inform us about debt levels relative to earnings. The first is net debt divided by earnings before interest, tax, depreciation, and amortization (EBITDA), while the second is how many times its earnings before interest and tax (EBIT) covers its interest expense (or its interest cover, for short). This way, we consider both the absolute quantum of the debt, as well as the interest rates paid on it.
Trinity Industries shareholders face the double whammy of a high net debt to EBITDA ratio (7.2), and fairly weak interest coverage, since EBIT is just 1.7 times the interest expense. The debt burden here is substantial. Looking on the bright side, Trinity Industries boosted its EBIT by a silky 35% in the last year. Like a mother's loving embrace of a newborn that sort of growth builds resilience, putting the company in a stronger position to manage its debt. The balance sheet is clearly the area to focus on when you are analysing debt. But it is future earnings, more than anything, that will determine Trinity Industries's ability to maintain a healthy balance sheet going forward. So if you're focused on the future you can check out this free report showing analyst profit forecasts.
Finally, a business needs free cash flow to pay off debt; accounting profits just don't cut it. So it's worth checking how much of that EBIT is backed by free cash flow. Over the last three years, Trinity Industries saw substantial negative free cash flow, in total. While that may be a result of expenditure for growth, it does make the debt far more risky.
Our View
To be frank both Trinity Industries's conversion of EBIT to free cash flow and its track record of staying on top of its total liabilities make us rather uncomfortable with its debt levels. But on the bright side, its EBIT growth rate is a good sign, and makes us more optimistic. Overall, it seems to us that Trinity Industries's balance sheet is really quite a risk to the business. For this reason we're pretty cautious about the stock, and we think shareholders should keep a close eye on its liquidity. The balance sheet is clearly the area to focus on when you are analysing debt. But ultimately, every company can contain risks that exist outside of the balance sheet. Case in point: We've spotted 3 warning signs for Trinity Industries you should be aware of, and 1 of them is a bit unpleasant.
If you're interested in investing in businesses that can grow profits without the burden of debt, then check out this free list of growing businesses that have net cash on the balance sheet.
If you spot an error that warrants correction, please contact the editor at editorial-team@simplywallst.com. This article by Simply Wall St is general in nature. It does not constitute a recommendation to buy or sell any stock, and does not take account of your objectives, or your financial situation. Simply Wall St has no position in the stocks mentioned.
We aim to bring you long-term focused research analysis driven by fundamental data. Note that our analysis may not factor in the latest price-sensitive company announcements or qualitative material. Thank you for reading.
About NYSE:TRN
Trinity Industries
Provides railcar products and services under the TrinityRail trade name in North America.
Average dividend payer slight.
Similar Companies
Market Insights


Advertisement
Community Narratives
The Future of Drug Testing? Fingerprint Tech Shows Serious Promise
Fair Value US$2.98|43.0% undervalued
JO
Community Contributor
Suncorp’s Next Chapter: Insurance-Only and Ready to Grow
Fair Value AU$22.83|7.6% undervalued
RO
Community Contributor
Thyssenkrupp Nucera Will Achieve Double-Digit Profits by 2030 Boosted by Hydrogen Growth
Fair Value €14.40|30.6% undervalued
CH
Community Contributor
Tesla’s Nvidia Moment – The AI & Robotics Inflection Point
Fair Value US$359.72|18.3% undervalued
BL
Community Contributor