Advertisement
- United States
- /
- Aerospace & Defense
- /
- NYSE:RTX
Can RTX’s Valuation Keep Up With Pentagon Push for Missile Production?

Simply Wall St
Reviewed by Bailey Pemberton
If you are looking at RTX stock and wondering whether it is time to take action, you are definitely not alone. With the share price closing at $168.8, RTX has caught the attention of investors thanks to its impressive run this year. In just the past week, it gained 3.2%, topping that with a 7.2% jump over the last 30 days. Even more striking, the year-to-date return sits at 45.5%. If you have been holding long, the stock has delivered a staggering 213.8% over five years.
Those big returns did not come out of nowhere. News of the Pentagon urging missile suppliers, including RTX, to ramp up production has only amplified interest, especially with global tensions running high. Despite recent technical hiccups at European airports tied to software incidents, the company’s vital role in defense and aerospace keeps it in focus. In addition, policy changes around military drone exports and supply chain maneuvering amid U.S.-China trade tensions further underline why investors see real momentum here.
But while price moves and headlines are exciting, what about RTX’s valuation? Looking at different methods, the company is currently undervalued in 1 out of 6 standard valuation checks. That leaves us with plenty of ground to cover. Up next, we will break down how analysts and investors are assessing RTX’s value and, before wrapping up, I will share a smarter perspective for judging if the stock is truly a good fit for your portfolio.
RTX scores just 1/6 on our valuation checks. See what other red flags we found in the full valuation breakdown.
Approach 1: RTX Discounted Cash Flow (DCF) Analysis
The Discounted Cash Flow (DCF) model estimates a company’s intrinsic worth by forecasting future cash flows and discounting them to their present value. This approach helps investors determine what a company is truly worth today, assuming its future performance aligns with projections.
For RTX, the current Free Cash Flow stands at $2.40 Billion. According to analyst estimates, RTX’s annual Free Cash Flow is expected to grow substantially and reach $10.68 Billion by 2029. While experts typically provide forecasts up to five years, further projections beyond that point are calculated based on recent trends and reasonable assumptions by analytics providers.
Using this projected growth, the DCF model arrives at an estimated intrinsic value of $129.15 per share for RTX. Compared to the current market price of $168.80, this suggests the stock is trading at a 30.7% premium. This means it is overvalued based on this specific model and set of assumptions.
Result: OVERVALUED
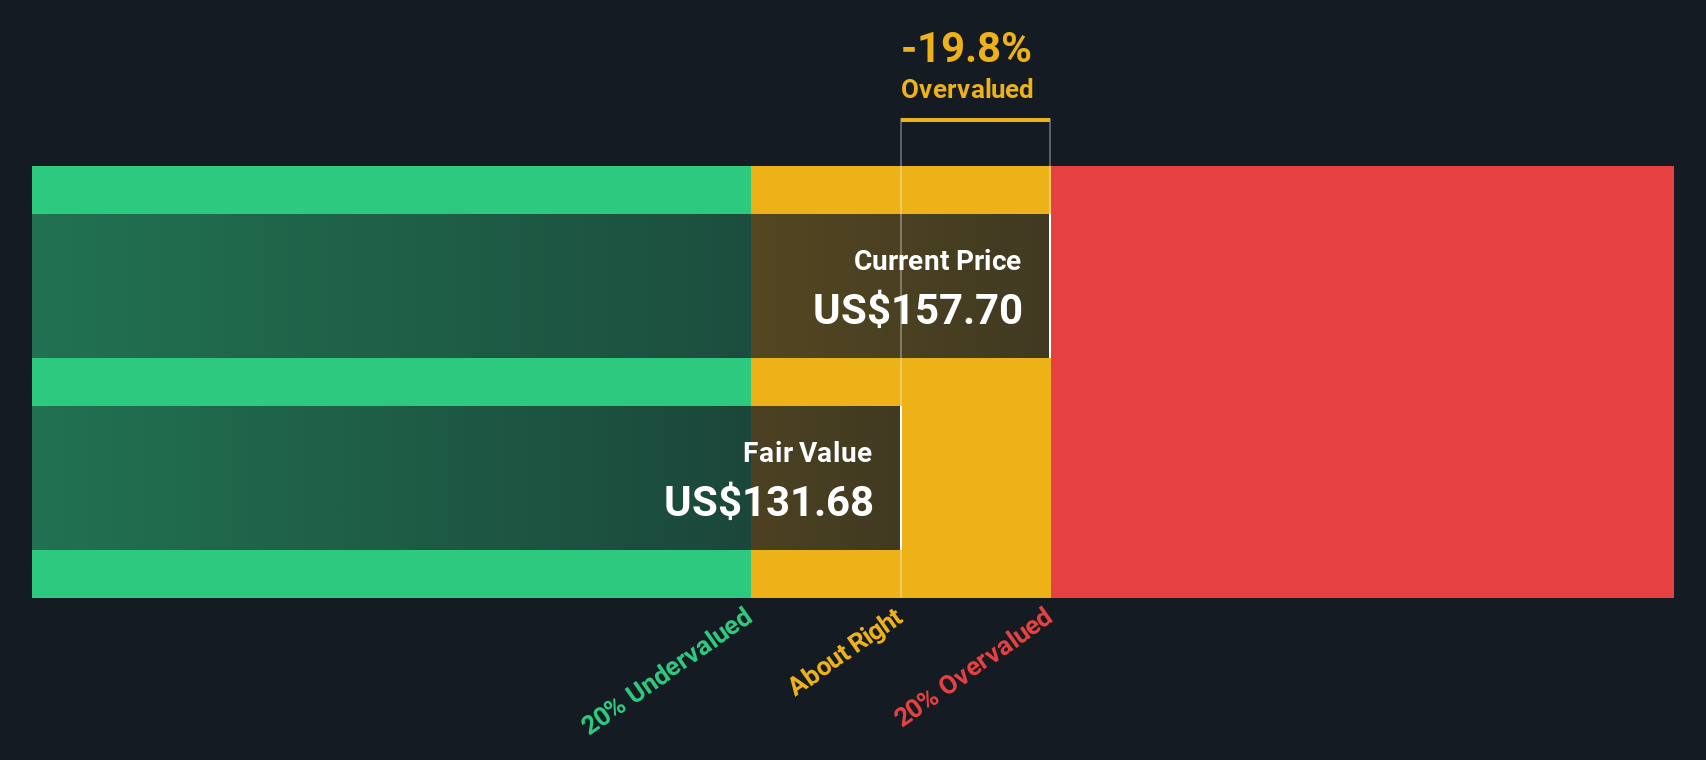
Our Discounted Cash Flow (DCF) analysis suggests RTX may be overvalued by 30.7%. Find undervalued stocks or create your own screener to find better value opportunities.
Approach 2: RTX Price vs Earnings (P/E Ratio)
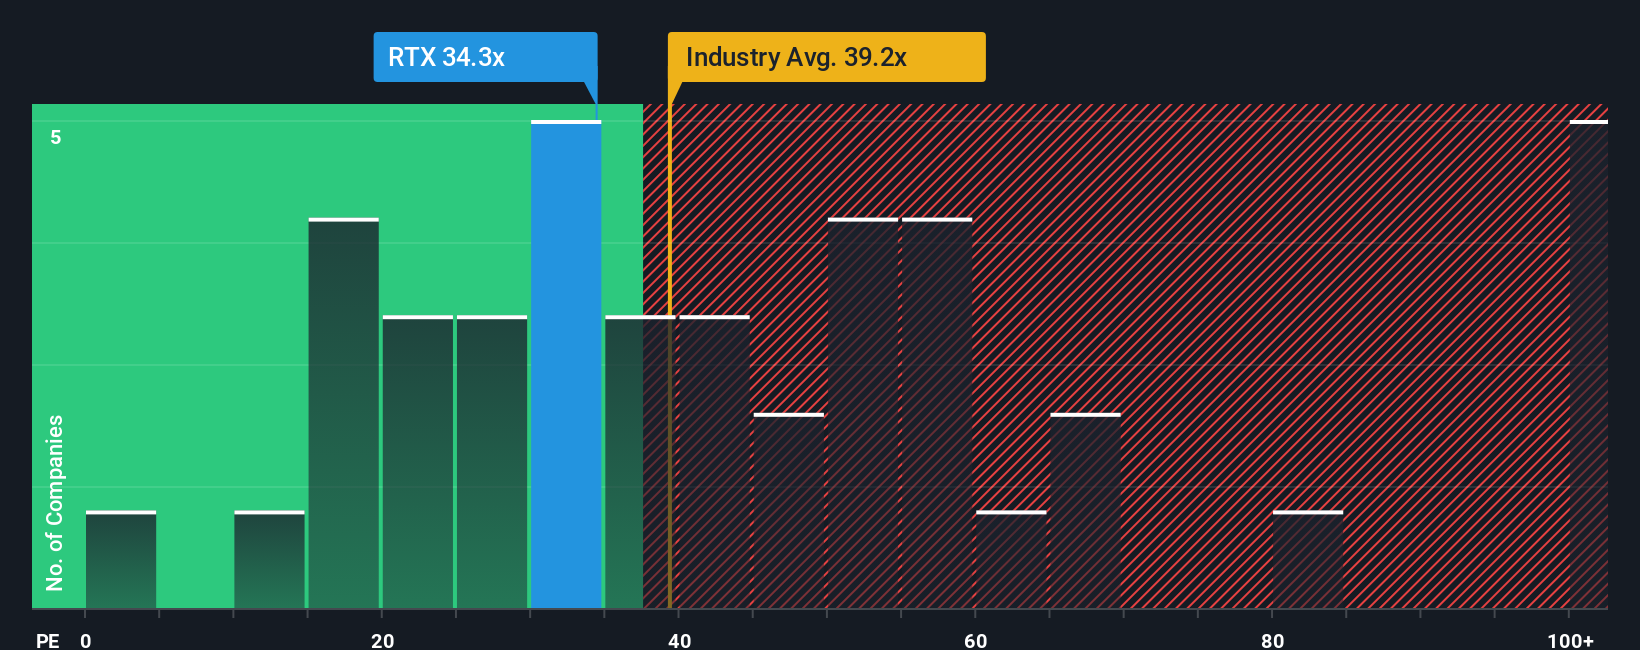
The price-to-earnings (P/E) ratio is a widely used metric for valuing profitable companies like RTX, as it relates the current share price to per-share earnings. This measure works well for established firms because it reflects how much investors are willing to pay for a dollar of the company’s earnings, offering a clear window into market sentiment and profitability.
It is important to remember that what counts as a “normal” or “fair” P/E ratio depends on the company’s growth prospects and perceived risk. High-growth companies often justify higher P/E ratios, while riskier business models or volatile earnings typically call for lower ones. For RTX, the current P/E ratio stands at 36.8x. This is slightly below the Aerospace & Defense industry average of 39.9x and above the peer average of 28.9x. These comparisons provide some useful context but do not always tell the whole story.
This is where Simply Wall St’s proprietary “Fair Ratio” comes in. The Fair Ratio, calculated at 33.6x for RTX, represents a more comprehensive benchmark. It considers factors like RTX’s forecasted earnings growth, risk profile, profit margins, market capitalization, and industry context. This offers a tailored approach rather than relying solely on blunt industry or peer averages.
When we compare RTX’s actual P/E ratio of 36.8x to the Fair Ratio of 33.6x, the stock appears to be trading at a modest premium. This difference suggests RTX may be priced a bit ahead of its fundamentals when considering the broader context. While not dramatically overvalued, it is currently above what would be “fair” using this more nuanced standard.
Result: OVERVALUED
PE ratios tell one story, but what if the real opportunity lies elsewhere? Discover companies where insiders are betting big on explosive growth.
Upgrade Your Decision Making: Choose your RTX Narrative
Earlier we mentioned that there is an even better way to understand valuation, so let us introduce you to Narratives. A Narrative is a simple, user-friendly way of making your perspective on a company concrete: it is the story or thesis you believe about RTX, tied directly to your financial expectations such as fair value, future revenue, earnings, and margin estimates.
Narratives work by linking the company’s outlook and risks to your own forecast, and then automatically calculate a fair value based on your assumptions. This bridges the gap between numbers and the real-world story. On Simply Wall St’s Community page, millions of investors use Narratives to easily compare their valuation with others and to check in real time how new developments like news or earnings updates alter their investment thesis.
This makes it easy to decide when to buy or sell: compare your Narrative’s fair value to the current price and see if your story still adds up. Narratives are dynamic. When fresh data comes in, or something major happens at RTX, your Narrative and valuation update instantly.
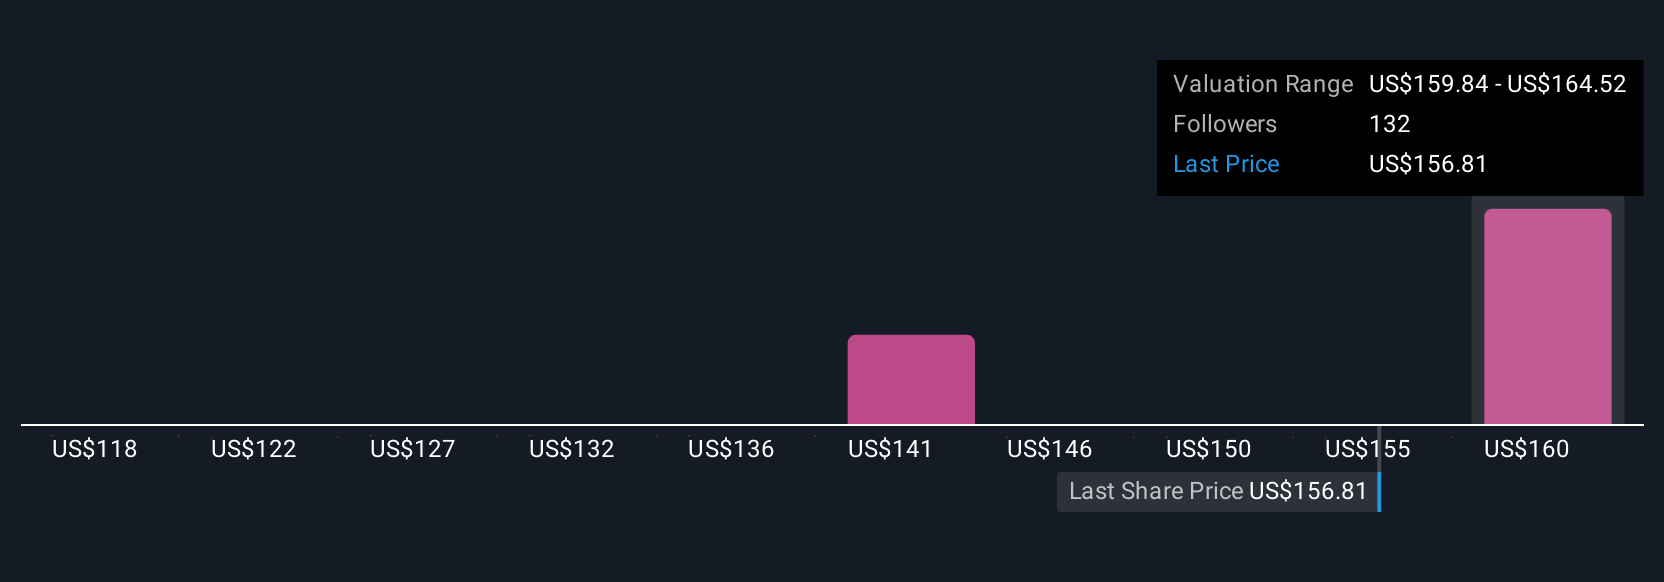
For example, right now, the most bullish Narrative for RTX sees the stock reaching $180 by betting on expanding defense contracts and strong commercial aerospace performance, while the most cautious Narrative projects just $134 citing risks like tariff volatility and engine cost overruns. Whatever your view, Narratives let your personal insight drive your investing decisions.
Do you think there's more to the story for RTX? Create your own Narrative to let the Community know!
This article by Simply Wall St is general in nature. We provide commentary based on historical data and analyst forecasts only using an unbiased methodology and our articles are not intended to be financial advice. It does not constitute a recommendation to buy or sell any stock, and does not take account of your objectives, or your financial situation. We aim to bring you long-term focused analysis driven by fundamental data. Note that our analysis may not factor in the latest price-sensitive company announcements or qualitative material. Simply Wall St has no position in any stocks mentioned.
New: AI Stock Screener & Alerts
Our new AI Stock Screener scans the market every day to uncover opportunities.
• Dividend Powerhouses (3%+ Yield)
• Undervalued Small Caps with Insider Buying
• High growth Tech and AI Companies
Or build your own from over 50 metrics.
Have feedback on this article? Concerned about the content? Get in touch with us directly. Alternatively, email editorial-team@simplywallst.com
About NYSE:RTX
RTX
An aerospace and defense company, provides systems and services for the commercial, military, and government customers in the United States and internationally.
Solid track record with mediocre balance sheet.
Similar Companies
Market Insights

Advertisement
Community Narratives
The Next Phase of Energy Storage: How NeoVolta Is Tackling America’s Power Crunch
Fair Value US$7.50|30.4% undervalued
MA
Community Contributor
A formidable player in AI and enterprise computing.
Fair Value US$210.00|3.0% undervalued
CO
Community Contributor
IREN's Bold Moves in Sustainable Bitcoin Mining & AI Data Centers
Fair Value US$72.52|20.4% undervalued
BL
Community Contributor
Cooling the Champions: The Aussie Tech Behind F1's Victories
Fair Value AU$12.40|38.1% undervalued
TR
Community Contributor