
Advertisement
Howard Marks put it nicely when he said that, rather than worrying about share price volatility, 'The possibility of permanent loss is the risk I worry about... and every practical investor I know worries about.' So it might be obvious that you need to consider debt, when you think about how risky any given stock is, because too much debt can sink a company. We note that MasterBrand, Inc. (NYSE:MBC) does have debt on its balance sheet. But is this debt a concern to shareholders?
Why Does Debt Bring Risk?
Debt and other liabilities become risky for a business when it cannot easily fulfill those obligations, either with free cash flow or by raising capital at an attractive price. In the worst case scenario, a company can go bankrupt if it cannot pay its creditors. However, a more frequent (but still costly) occurrence is where a company must issue shares at bargain-basement prices, permanently diluting shareholders, just to shore up its balance sheet. Of course, debt can be an important tool in businesses, particularly capital heavy businesses. The first step when considering a company's debt levels is to consider its cash and debt together.
Check out our latest analysis for MasterBrand
What Is MasterBrand's Debt?
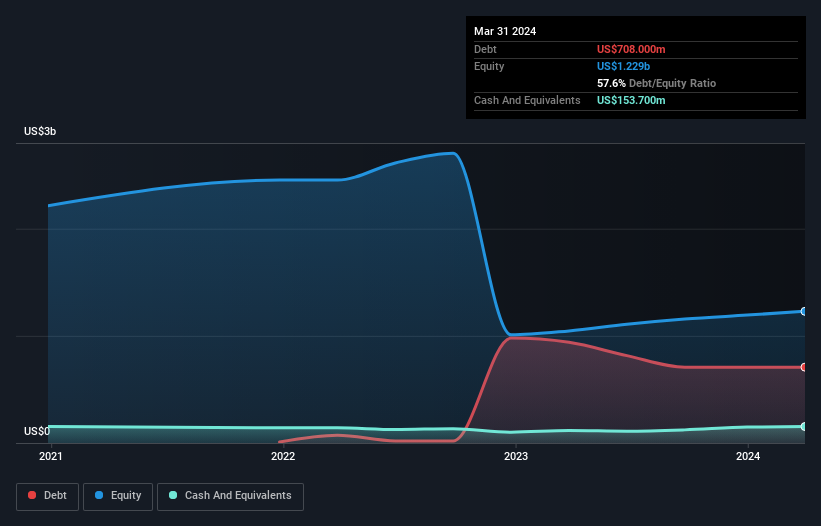
You can click the graphic below for the historical numbers, but it shows that MasterBrand had US$708.0m of debt in March 2024, down from US$939.6m, one year before. However, it does have US$153.7m in cash offsetting this, leading to net debt of about US$554.3m.
How Healthy Is MasterBrand's Balance Sheet?
We can see from the most recent balance sheet that MasterBrand had liabilities of US$340.4m falling due within a year, and liabilities of US$830.7m due beyond that. Offsetting these obligations, it had cash of US$153.7m as well as receivables valued at US$224.4m due within 12 months. So its liabilities total US$793.0m more than the combination of its cash and short-term receivables.
While this might seem like a lot, it is not so bad since MasterBrand has a market capitalization of US$1.89b, and so it could probably strengthen its balance sheet by raising capital if it needed to. However, it is still worthwhile taking a close look at its ability to pay off debt.
We measure a company's debt load relative to its earnings power by looking at its net debt divided by its earnings before interest, tax, depreciation, and amortization (EBITDA) and by calculating how easily its earnings before interest and tax (EBIT) cover its interest expense (interest cover). The advantage of this approach is that we take into account both the absolute quantum of debt (with net debt to EBITDA) and the actual interest expenses associated with that debt (with its interest cover ratio).
MasterBrand has net debt worth 1.5 times EBITDA, which isn't too much, but its interest cover looks a bit on the low side, with EBIT at only 4.9 times the interest expense. While these numbers do not alarm us, it's worth noting that the cost of the company's debt is having a real impact. We saw MasterBrand grow its EBIT by 2.4% in the last twelve months. That's far from incredible but it is a good thing, when it comes to paying off debt. The balance sheet is clearly the area to focus on when you are analysing debt. But ultimately the future profitability of the business will decide if MasterBrand can strengthen its balance sheet over time. So if you're focused on the future you can check out this free report showing analyst profit forecasts.
Finally, a business needs free cash flow to pay off debt; accounting profits just don't cut it. So we clearly need to look at whether that EBIT is leading to corresponding free cash flow. Over the most recent three years, MasterBrand recorded free cash flow worth 73% of its EBIT, which is around normal, given free cash flow excludes interest and tax. This free cash flow puts the company in a good position to pay down debt, when appropriate.
Our View
On our analysis MasterBrand's conversion of EBIT to free cash flow should signal that it won't have too much trouble with its debt. However, our other observations weren't so heartening. For example, its level of total liabilities makes us a little nervous about its debt. When we consider all the elements mentioned above, it seems to us that MasterBrand is managing its debt quite well. But a word of caution: we think debt levels are high enough to justify ongoing monitoring. When analysing debt levels, the balance sheet is the obvious place to start. However, not all investment risk resides within the balance sheet - far from it. Case in point: We've spotted 1 warning sign for MasterBrand you should be aware of.
If, after all that, you're more interested in a fast growing company with a rock-solid balance sheet, then check out our list of net cash growth stocks without delay.
New: Manage All Your Stock Portfolios in One Place
We've created the ultimate portfolio companion for stock investors, and it's free.
• Connect an unlimited number of Portfolios and see your total in one currency
• Be alerted to new Warning Signs or Risks via email or mobile
• Track the Fair Value of your stocks
Have feedback on this article? Concerned about the content? Get in touch with us directly. Alternatively, email editorial-team (at) simplywallst.com.
This article by Simply Wall St is general in nature. We provide commentary based on historical data and analyst forecasts only using an unbiased methodology and our articles are not intended to be financial advice. It does not constitute a recommendation to buy or sell any stock, and does not take account of your objectives, or your financial situation. We aim to bring you long-term focused analysis driven by fundamental data. Note that our analysis may not factor in the latest price-sensitive company announcements or qualitative material. Simply Wall St has no position in any stocks mentioned.
Have feedback on this article? Concerned about the content? Get in touch with us directly. Alternatively, email editorial-team@simplywallst.com
About NYSE:MBC
MasterBrand
Engages in the manufacture and sale of residential cabinets in the United States and Canada.
Slight risk and fair value.
Similar Companies
Market Insights


Advertisement
Community Narratives
America Wants Homegrown Drones — Draganfly Is Ready to Deliver
Fair Value US$9.21|27.4% undervalued
JO
Community Contributor
Cheesecake Factory offers an enticing opportunity for long-term growth by leveraging new concepts
Fair Value US$73.83|25.8% undervalued
ZW
Community Contributor
Coca-Cola’s Intrinsic Value Set to Rise with Fed Rate Cut
Fair Value US$67.50|2.7% undervalued
AL
Community Contributor
Fully Permitted Gold Mine with 50 Baggers Potential 
Fair Value CA$41.00|98.0% undervalued
RO
Community Contributor