

David Iben put it well when he said, 'Volatility is not a risk we care about. What we care about is avoiding the permanent loss of capital.' It's only natural to consider a company's balance sheet when you examine how risky it is, since debt is often involved when a business collapses. We note that Lindsay Corporation (NYSE:LNN) does have debt on its balance sheet. But is this debt a concern to shareholders?
When Is Debt Dangerous?
Generally speaking, debt only becomes a real problem when a company can't easily pay it off, either by raising capital or with its own cash flow. If things get really bad, the lenders can take control of the business. However, a more frequent (but still costly) occurrence is where a company must issue shares at bargain-basement prices, permanently diluting shareholders, just to shore up its balance sheet. By replacing dilution, though, debt can be an extremely good tool for businesses that need capital to invest in growth at high rates of return. The first step when considering a company's debt levels is to consider its cash and debt together.
View our latest analysis for Lindsay
What Is Lindsay's Net Debt?
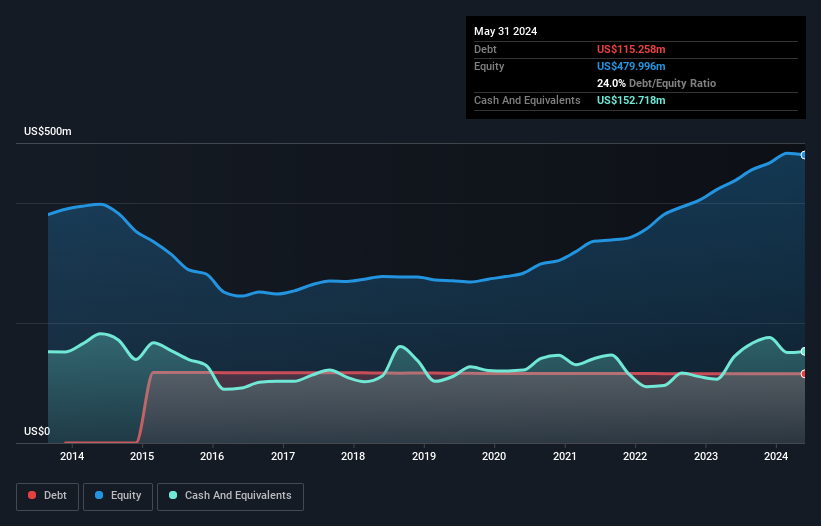
As you can see below, Lindsay had US$115.3m of debt, at May 2024, which is about the same as the year before. You can click the chart for greater detail. However, its balance sheet shows it holds US$152.7m in cash, so it actually has US$37.5m net cash.
How Strong Is Lindsay's Balance Sheet?
We can see from the most recent balance sheet that Lindsay had liabilities of US$123.7m falling due within a year, and liabilities of US$154.4m due beyond that. Offsetting this, it had US$152.7m in cash and US$138.1m in receivables that were due within 12 months. So it can boast US$12.7m more liquid assets than total liabilities.
This state of affairs indicates that Lindsay's balance sheet looks quite solid, as its total liabilities are just about equal to its liquid assets. So while it's hard to imagine that the US$1.32b company is struggling for cash, we still think it's worth monitoring its balance sheet. Succinctly put, Lindsay boasts net cash, so it's fair to say it does not have a heavy debt load!
But the bad news is that Lindsay has seen its EBIT plunge 19% in the last twelve months. If that rate of decline in earnings continues, the company could find itself in a tight spot. When analysing debt levels, the balance sheet is the obvious place to start. But ultimately the future profitability of the business will decide if Lindsay can strengthen its balance sheet over time. So if you're focused on the future you can check out this free report showing analyst profit forecasts.
Finally, while the tax-man may adore accounting profits, lenders only accept cold hard cash. Lindsay may have net cash on the balance sheet, but it is still interesting to look at how well the business converts its earnings before interest and tax (EBIT) to free cash flow, because that will influence both its need for, and its capacity to manage debt. Looking at the most recent three years, Lindsay recorded free cash flow of 44% of its EBIT, which is weaker than we'd expect. That weak cash conversion makes it more difficult to handle indebtedness.
Summing Up
While we empathize with investors who find debt concerning, you should keep in mind that Lindsay has net cash of US$37.5m, as well as more liquid assets than liabilities. So we are not troubled with Lindsay's debt use. Over time, share prices tend to follow earnings per share, so if you're interested in Lindsay, you may well want to click here to check an interactive graph of its earnings per share history.
At the end of the day, it's often better to focus on companies that are free from net debt. You can access our special list of such companies (all with a track record of profit growth). It's free.
New: AI Stock Screener & Alerts
Our new AI Stock Screener scans the market every day to uncover opportunities.
• Dividend Powerhouses (3%+ Yield)
• Undervalued Small Caps with Insider Buying
• High growth Tech and AI Companies
Or build your own from over 50 metrics.
Have feedback on this article? Concerned about the content? Get in touch with us directly. Alternatively, email editorial-team (at) simplywallst.com.
This article by Simply Wall St is general in nature. We provide commentary based on historical data and analyst forecasts only using an unbiased methodology and our articles are not intended to be financial advice. It does not constitute a recommendation to buy or sell any stock, and does not take account of your objectives, or your financial situation. We aim to bring you long-term focused analysis driven by fundamental data. Note that our analysis may not factor in the latest price-sensitive company announcements or qualitative material. Simply Wall St has no position in any stocks mentioned.
About NYSE:LNN
Lindsay
Provides water management and road infrastructure products and services in the United States and internationally.
Flawless balance sheet average dividend payer.

