- United States
- /
- Machinery
- /
- NYSE:KAI
Kadant Inc.'s (NYSE:KAI) Stock's On An Uptrend: Are Strong Financials Guiding The Market?


Most readers would already be aware that Kadant's (NYSE:KAI) stock increased significantly by 6.6% over the past week. Given the company's impressive performance, we decided to study its financial indicators more closely as a company's financial health over the long-term usually dictates market outcomes. Particularly, we will be paying attention to Kadant's ROE today.
Return on equity or ROE is a key measure used to assess how efficiently a company's management is utilizing the company's capital. In other words, it is a profitability ratio which measures the rate of return on the capital provided by the company's shareholders.
Check out our latest analysis for Kadant
How Do You Calculate Return On Equity?
Return on equity can be calculated by using the formula:
Return on Equity = Net Profit (from continuing operations) ÷ Shareholders' Equity
So, based on the above formula, the ROE for Kadant is:
13% = US$113m ÷ US$858m (Based on the trailing twelve months to December 2024).
The 'return' is the income the business earned over the last year. Another way to think of that is that for every $1 worth of equity, the company was able to earn $0.13 in profit.
Why Is ROE Important For Earnings Growth?
Thus far, we have learned that ROE measures how efficiently a company is generating its profits. Depending on how much of these profits the company reinvests or "retains", and how effectively it does so, we are then able to assess a company’s earnings growth potential. Assuming everything else remains unchanged, the higher the ROE and profit retention, the higher the growth rate of a company compared to companies that don't necessarily bear these characteristics.
Kadant's Earnings Growth And 13% ROE
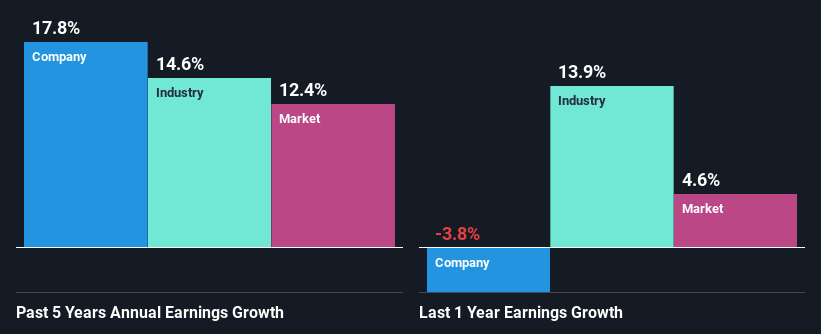
At first glance, Kadant seems to have a decent ROE. Even when compared to the industry average of 14% the company's ROE looks quite decent. Consequently, this likely laid the ground for the decent growth of 18% seen over the past five years by Kadant.
As a next step, we compared Kadant's net income growth with the industry, and pleasingly, we found that the growth seen by the company is higher than the average industry growth of 15%.
The basis for attaching value to a company is, to a great extent, tied to its earnings growth. It’s important for an investor to know whether the market has priced in the company's expected earnings growth (or decline). This then helps them determine if the stock is placed for a bright or bleak future. One good indicator of expected earnings growth is the P/E ratio which determines the price the market is willing to pay for a stock based on its earnings prospects. So, you may want to check if Kadant is trading on a high P/E or a low P/E, relative to its industry.
Is Kadant Efficiently Re-investing Its Profits?
In Kadant's case, its respectable earnings growth can probably be explained by its low three-year median payout ratio of 12% (or a retention ratio of 88%), which suggests that the company is investing most of its profits to grow its business.
Additionally, Kadant has paid dividends over a period of at least ten years which means that the company is pretty serious about sharing its profits with shareholders.
Conclusion
In total, we are pretty happy with Kadant's performance. Specifically, we like that the company is reinvesting a huge chunk of its profits at a high rate of return. This of course has caused the company to see substantial growth in its earnings. Having said that, the company's earnings growth is expected to slow down, as forecasted in the current analyst estimates. Are these analysts expectations based on the broad expectations for the industry, or on the company's fundamentals? Click here to be taken to our analyst's forecasts page for the company.
Valuation is complex, but we're here to simplify it.
Discover if Kadant might be undervalued or overvalued with our detailed analysis, featuring fair value estimates, potential risks, dividends, insider trades, and its financial condition.
Access Free AnalysisHave feedback on this article? Concerned about the content? Get in touch with us directly. Alternatively, email editorial-team (at) simplywallst.com.
This article by Simply Wall St is general in nature. We provide commentary based on historical data and analyst forecasts only using an unbiased methodology and our articles are not intended to be financial advice. It does not constitute a recommendation to buy or sell any stock, and does not take account of your objectives, or your financial situation. We aim to bring you long-term focused analysis driven by fundamental data. Note that our analysis may not factor in the latest price-sensitive company announcements or qualitative material. Simply Wall St has no position in any stocks mentioned.
About NYSE:KAI
Flawless balance sheet with questionable track record.
Similar Companies
Market Insights

Community Narratives

