- United States
- /
- Building
- /
- NYSE:JCI
Estimating The Fair Value Of Johnson Controls International plc (NYSE:JCI)


Key Insights
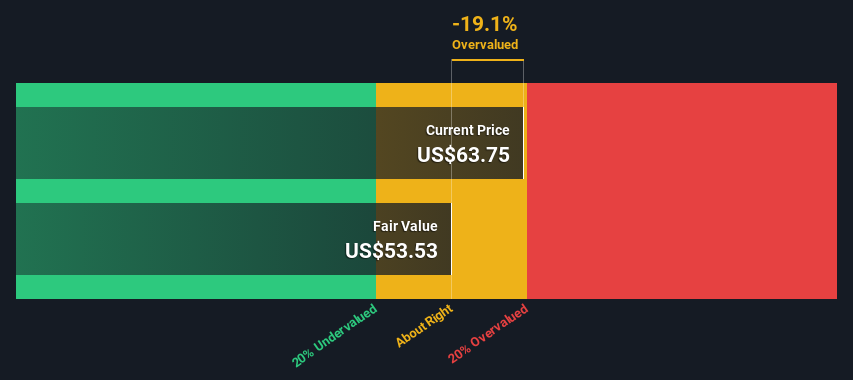
- Using the 2 Stage Free Cash Flow to Equity, Johnson Controls International fair value estimate is US$53.53
- Johnson Controls International's US$63.75 share price indicates it is trading at similar levels as its fair value estimate
- The US$64.44 analyst price target for JCI is 20% more than our estimate of fair value
How far off is Johnson Controls International plc (NYSE:JCI) from its intrinsic value? Using the most recent financial data, we'll take a look at whether the stock is fairly priced by projecting its future cash flows and then discounting them to today's value. One way to achieve this is by employing the Discounted Cash Flow (DCF) model. Models like these may appear beyond the comprehension of a lay person, but they're fairly easy to follow.
Remember though, that there are many ways to estimate a company's value, and a DCF is just one method. Anyone interested in learning a bit more about intrinsic value should have a read of the Simply Wall St analysis model.
Check out our latest analysis for Johnson Controls International
The Method
We're using the 2-stage growth model, which simply means we take in account two stages of company's growth. In the initial period the company may have a higher growth rate and the second stage is usually assumed to have a stable growth rate. In the first stage we need to estimate the cash flows to the business over the next ten years. Where possible we use analyst estimates, but when these aren't available we extrapolate the previous free cash flow (FCF) from the last estimate or reported value. We assume companies with shrinking free cash flow will slow their rate of shrinkage, and that companies with growing free cash flow will see their growth rate slow, over this period. We do this to reflect that growth tends to slow more in the early years than it does in later years.
A DCF is all about the idea that a dollar in the future is less valuable than a dollar today, so we discount the value of these future cash flows to their estimated value in today's dollars:
10-year free cash flow (FCF) estimate
| 2024 | 2025 | 2026 | 2027 | 2028 | 2029 | 2030 | 2031 | 2032 | 2033 | |
| Levered FCF ($, Millions) | US$2.04b | US$2.60b | US$2.90b | US$3.42b | US$3.24b | US$3.15b | US$3.10b | US$3.10b | US$3.11b | US$3.15b |
| Growth Rate Estimate Source | Analyst x11 | Analyst x11 | Analyst x6 | Analyst x1 | Analyst x1 | Est @ -2.84% | Est @ -1.30% | Est @ -0.23% | Est @ 0.53% | Est @ 1.06% |
| Present Value ($, Millions) Discounted @ 9.5% | US$1.9k | US$2.2k | US$2.2k | US$2.4k | US$2.1k | US$1.8k | US$1.6k | US$1.5k | US$1.4k | US$1.3k |
("Est" = FCF growth rate estimated by Simply Wall St)
Present Value of 10-year Cash Flow (PVCF) = US$18b
The second stage is also known as Terminal Value, this is the business's cash flow after the first stage. The Gordon Growth formula is used to calculate Terminal Value at a future annual growth rate equal to the 5-year average of the 10-year government bond yield of 2.3%. We discount the terminal cash flows to today's value at a cost of equity of 9.5%.
Terminal Value (TV)= FCF2033 × (1 + g) ÷ (r – g) = US$3.1b× (1 + 2.3%) ÷ (9.5%– 2.3%) = US$45b
Present Value of Terminal Value (PVTV)= TV / (1 + r)10= US$45b÷ ( 1 + 9.5%)10= US$18b
The total value, or equity value, is then the sum of the present value of the future cash flows, which in this case is US$36b. The last step is to then divide the equity value by the number of shares outstanding. Compared to the current share price of US$63.8, the company appears around fair value at the time of writing. Valuations are imprecise instruments though, rather like a telescope - move a few degrees and end up in a different galaxy. Do keep this in mind.
Important Assumptions
The calculation above is very dependent on two assumptions. The first is the discount rate and the other is the cash flows. If you don't agree with these result, have a go at the calculation yourself and play with the assumptions. The DCF also does not consider the possible cyclicality of an industry, or a company's future capital requirements, so it does not give a full picture of a company's potential performance. Given that we are looking at Johnson Controls International as potential shareholders, the cost of equity is used as the discount rate, rather than the cost of capital (or weighted average cost of capital, WACC) which accounts for debt. In this calculation we've used 9.5%, which is based on a levered beta of 1.309. Beta is a measure of a stock's volatility, compared to the market as a whole. We get our beta from the industry average beta of globally comparable companies, with an imposed limit between 0.8 and 2.0, which is a reasonable range for a stable business.
SWOT Analysis for Johnson Controls International
- Earnings growth over the past year exceeded the industry.
- Debt is well covered by earnings and cashflows.
- Dividends are covered by earnings and cash flows.
- Dividend is low compared to the top 25% of dividend payers in the Building market.
- Annual earnings are forecast to grow for the next 3 years.
- Good value based on P/E ratio compared to estimated Fair P/E ratio.
- Annual earnings are forecast to grow slower than the American market.
Moving On:
Whilst important, the DCF calculation shouldn't be the only metric you look at when researching a company. It's not possible to obtain a foolproof valuation with a DCF model. Rather it should be seen as a guide to "what assumptions need to be true for this stock to be under/overvalued?" For instance, if the terminal value growth rate is adjusted slightly, it can dramatically alter the overall result. For Johnson Controls International, we've compiled three fundamental factors you should look at:
- Risks: For example, we've discovered 3 warning signs for Johnson Controls International that you should be aware of before investing here.
- Future Earnings: How does JCI's growth rate compare to its peers and the wider market? Dig deeper into the analyst consensus number for the upcoming years by interacting with our free analyst growth expectation chart.
- Other High Quality Alternatives: Do you like a good all-rounder? Explore our interactive list of high quality stocks to get an idea of what else is out there you may be missing!
PS. The Simply Wall St app conducts a discounted cash flow valuation for every stock on the NYSE every day. If you want to find the calculation for other stocks just search here.
New: Manage All Your Stock Portfolios in One Place
We've created the ultimate portfolio companion for stock investors, and it's free.
• Connect an unlimited number of Portfolios and see your total in one currency
• Be alerted to new Warning Signs or Risks via email or mobile
• Track the Fair Value of your stocks
Have feedback on this article? Concerned about the content? Get in touch with us directly. Alternatively, email editorial-team (at) simplywallst.com.
This article by Simply Wall St is general in nature. We provide commentary based on historical data and analyst forecasts only using an unbiased methodology and our articles are not intended to be financial advice. It does not constitute a recommendation to buy or sell any stock, and does not take account of your objectives, or your financial situation. We aim to bring you long-term focused analysis driven by fundamental data. Note that our analysis may not factor in the latest price-sensitive company announcements or qualitative material. Simply Wall St has no position in any stocks mentioned.
About NYSE:JCI
Johnson Controls International
Engages in engineering, manufacturing, commissioning, and retrofitting building products and systems in the United States, Europe, the Asia Pacific, and internationally.
Average dividend payer slight.
Similar Companies
Market Insights

Community Narratives

