
Advertisement
- United States
- /
- Trade Distributors
- /
- NYSE:GWW
Investing in W.W. Grainger (NYSE:GWW) five years ago would have delivered you a 275% gain

The worst result, after buying shares in a company (assuming no leverage), would be if you lose all the money you put in. But on a lighter note, a good company can see its share price rise well over 100%. One great example is W.W. Grainger, Inc. (NYSE:GWW) which saw its share price drive 250% higher over five years. We note the stock price is up 2.8% in the last seven days.
With that in mind, it's worth seeing if the company's underlying fundamentals have been the driver of long term performance, or if there are some discrepancies.
Check out our latest analysis for W.W. Grainger
There is no denying that markets are sometimes efficient, but prices do not always reflect underlying business performance. One imperfect but simple way to consider how the market perception of a company has shifted is to compare the change in the earnings per share (EPS) with the share price movement.
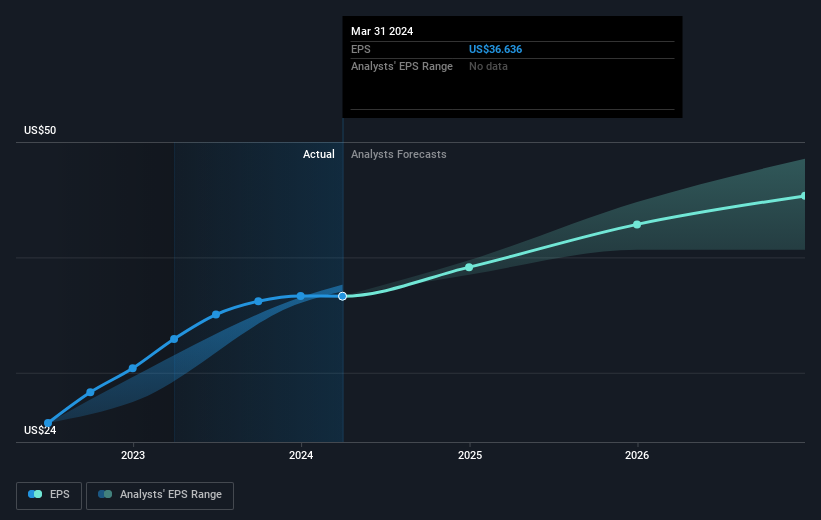
During five years of share price growth, W.W. Grainger achieved compound earnings per share (EPS) growth of 21% per year. This EPS growth is lower than the 28% average annual increase in the share price. This suggests that market participants hold the company in higher regard, these days. That's not necessarily surprising considering the five-year track record of earnings growth.
You can see how EPS has changed over time in the image below (click on the chart to see the exact values).
We know that W.W. Grainger has improved its bottom line over the last three years, but what does the future have in store? You can see how its balance sheet has strengthened (or weakened) over time in this free interactive graphic.
What About Dividends?
As well as measuring the share price return, investors should also consider the total shareholder return (TSR). Whereas the share price return only reflects the change in the share price, the TSR includes the value of dividends (assuming they were reinvested) and the benefit of any discounted capital raising or spin-off. So for companies that pay a generous dividend, the TSR is often a lot higher than the share price return. In the case of W.W. Grainger, it has a TSR of 275% for the last 5 years. That exceeds its share price return that we previously mentioned. And there's no prize for guessing that the dividend payments largely explain the divergence!
A Different Perspective
W.W. Grainger's TSR for the year was broadly in line with the market average, at 25%. We should note here that the five-year TSR is more impressive, at 30% per year. More recently, the share price growth has slowed. But it has to be said the overall picture is one of good long term and short term performance. Arguably that makes W.W. Grainger a stock worth watching. It's always interesting to track share price performance over the longer term. But to understand W.W. Grainger better, we need to consider many other factors. Consider for instance, the ever-present spectre of investment risk. We've identified 1 warning sign with W.W. Grainger , and understanding them should be part of your investment process.
Of course, you might find a fantastic investment by looking elsewhere. So take a peek at this free list of companies we expect will grow earnings.
Please note, the market returns quoted in this article reflect the market weighted average returns of stocks that currently trade on American exchanges.
Valuation is complex, but we're here to simplify it.
Discover if W.W. Grainger might be undervalued or overvalued with our detailed analysis, featuring fair value estimates, potential risks, dividends, insider trades, and its financial condition.
Access Free AnalysisHave feedback on this article? Concerned about the content? Get in touch with us directly. Alternatively, email editorial-team (at) simplywallst.com.
This article by Simply Wall St is general in nature. We provide commentary based on historical data and analyst forecasts only using an unbiased methodology and our articles are not intended to be financial advice. It does not constitute a recommendation to buy or sell any stock, and does not take account of your objectives, or your financial situation. We aim to bring you long-term focused analysis driven by fundamental data. Note that our analysis may not factor in the latest price-sensitive company announcements or qualitative material. Simply Wall St has no position in any stocks mentioned.
Have feedback on this article? Concerned about the content? Get in touch with us directly. Alternatively, email editorial-team@simplywallst.com
About NYSE:GWW
W.W. Grainger
Distributes maintenance, repair, and operating products and services primarily in North America, Japan, and the United Kingdom.
Solid track record with excellent balance sheet and pays a dividend.
Similar Companies
Market Insights


Advertisement
Community Narratives

Quality Assets, Cautious Expansion and Commodity Super-cycle To Deliver Steady Revenue Growth 
Fair Value US$20.44|5.2% undervalued
ST
Equity Analyst and Writer
Tullow Oil's Share Price Could Soar Up to 135% if Oil Holds at $70
Fair Value UK£0.45|64.0% undervalued
OI
Community Contributor