Advertisement
- United States
- /
- Construction
- /
- NYSE:EME
Where Does EMCOR Group Go Next After 33% 2024 Surge?

Simply Wall St
Reviewed by Simply Wall St
If you own EMCOR Group stock or are thinking of getting in, you’re likely wondering where this impressive run goes from here. The past few years have been nothing short of a rocket ride for EMCOR Group, with the stock up 727.4% over the last five years and 409.5% in just the past three. Even after that incredible surge, 2024 has brought another wave of strong performance, with shares logging a 33.1% gain since the start of the year. The last 30 days have seen a slight pullback of 4.1%, but that is a small dip compared to the longer-term trend. The 1-year return still stands at an eye-popping 61.7%. If you have been watching the big moves in industrial and construction stocks as investors become more bullish on infrastructure and expansion, you know these numbers reflect more than just a lucky streak.
With all that growth, you might be asking the key question: is EMCOR Group still undervalued, or has it finally run ahead of itself? Here is some good news for value hunters—the company scores a solid 5 out of 6 on our valuation score, meaning it passes the vast majority of traditional undervaluation checks. In the next section, I will break down these valuation approaches so you can see exactly where EMCOR stands. Later, I will share an additional perspective on value, one that can make a difference for long-term investors.
EMCOR Group delivered 61.7% returns over the last year. See how this stacks up to the rest of the Construction industry.Approach 1: EMCOR Group Cash Flows
A Discounted Cash Flow (DCF) model estimates what a company is really worth by projecting future cash flows and then discounting them back to today’s value. In EMCOR Group’s case, the most recent Free Cash Flow (FCF) was about $1.21 billion. Analysts forecast steady growth, with FCF expected to reach $2.76 billion by 2029. While analyst estimates typically extend only about five years, further projections have been extrapolated to provide estimates for the remainder of the decade.
Based on these projections, the estimated intrinsic value of EMCOR Group stock is $1,314 per share. With a DCF-implied discount of 53.6%, the analysis suggests EMCOR Group is currently 53.6% undervalued relative to its intrinsic worth. This indicates that, despite recent strong gains, the stock may still have substantial upside from a cash flow perspective.
Result: UNDERVALUED
Head to the Valuation section of our Company Report for more details on how we arrive at this Fair Value for EMCOR Group.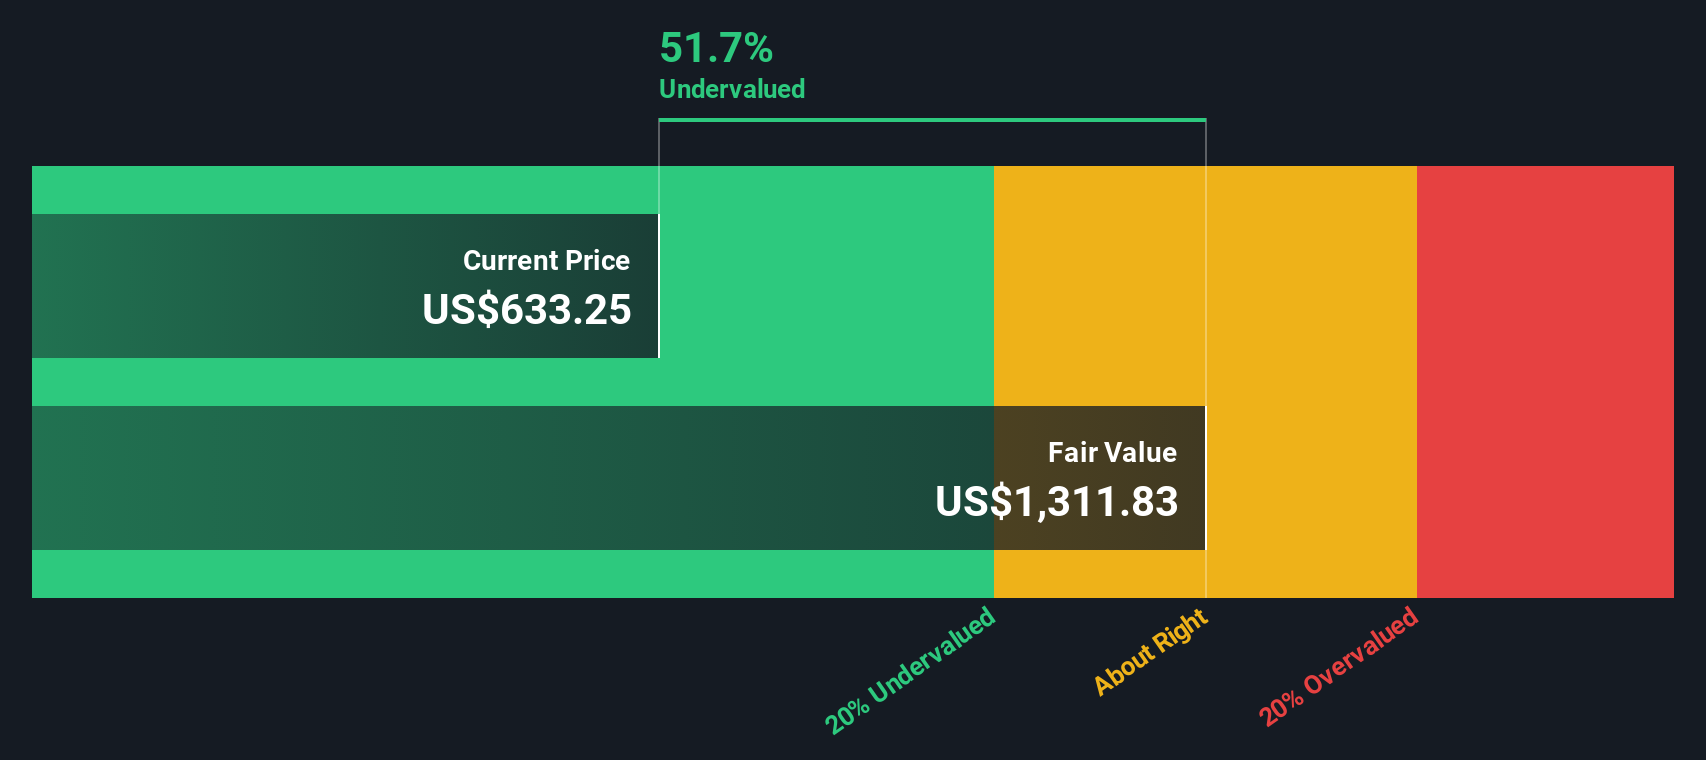
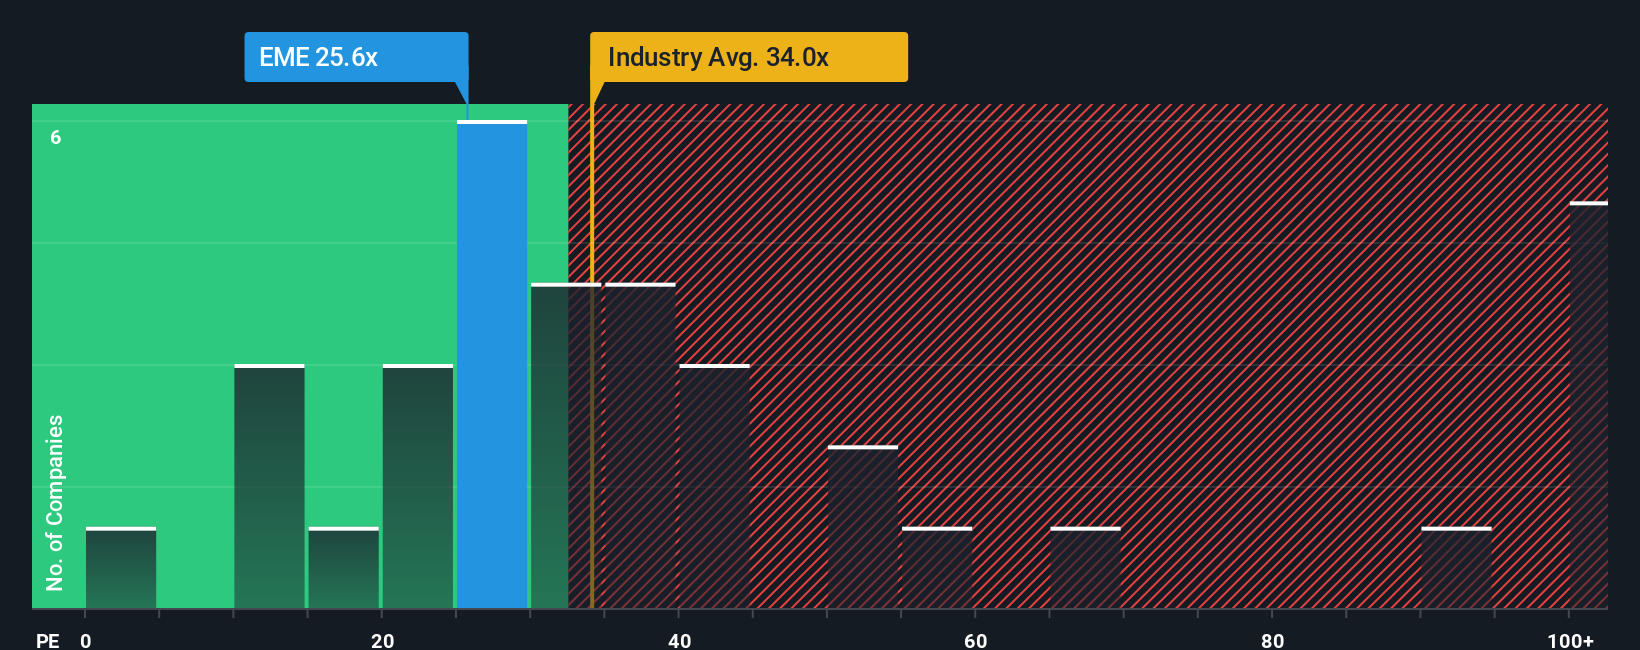
Approach 2: EMCOR Group Price vs Earnings
The Price-to-Earnings (PE) ratio is widely used to value profitable companies because it directly connects a company’s share price with its earnings power. Investors often turn to the PE ratio as a quick gauge of what the market is willing to pay for each dollar of earnings. It is important to remember that the “right” PE ratio depends on a company’s expected growth and risk. Higher-growth, lower-risk businesses typically command higher PE ratios, while more volatile or slower-growing firms usually trade at lower multiples.
EMCOR Group currently trades at a PE ratio of 24.7x. For context, the average PE ratio for the construction industry sits at 32.4x, and EMCOR’s peers average an even higher 54.3x. On the surface, EMCOR’s valuation looks conservative relative to industry standards and its closest competitors.
Rather than just relying on industry averages, Simply Wall St’s proprietary Fair Ratio goes a step further. It calculates what the PE should be, taking into account EMCOR’s unique mix of earnings growth, profit margins, market cap, risk profile, and its place within the industry. For EMCOR Group, the Fair Ratio is 27.6x. This nuanced approach provides a more accurate benchmark than a broad comparison to peers, as it recognizes the specific strengths and challenges of the business.
Since EMCOR’s current PE of 24.7x is moderately below its Fair Ratio of 27.6x, this suggests the stock is trading at a discount based on its earnings fundamentals.
Result: UNDERVALUED
Upgrade Your Decision Making: Choose your EMCOR Group Narrative
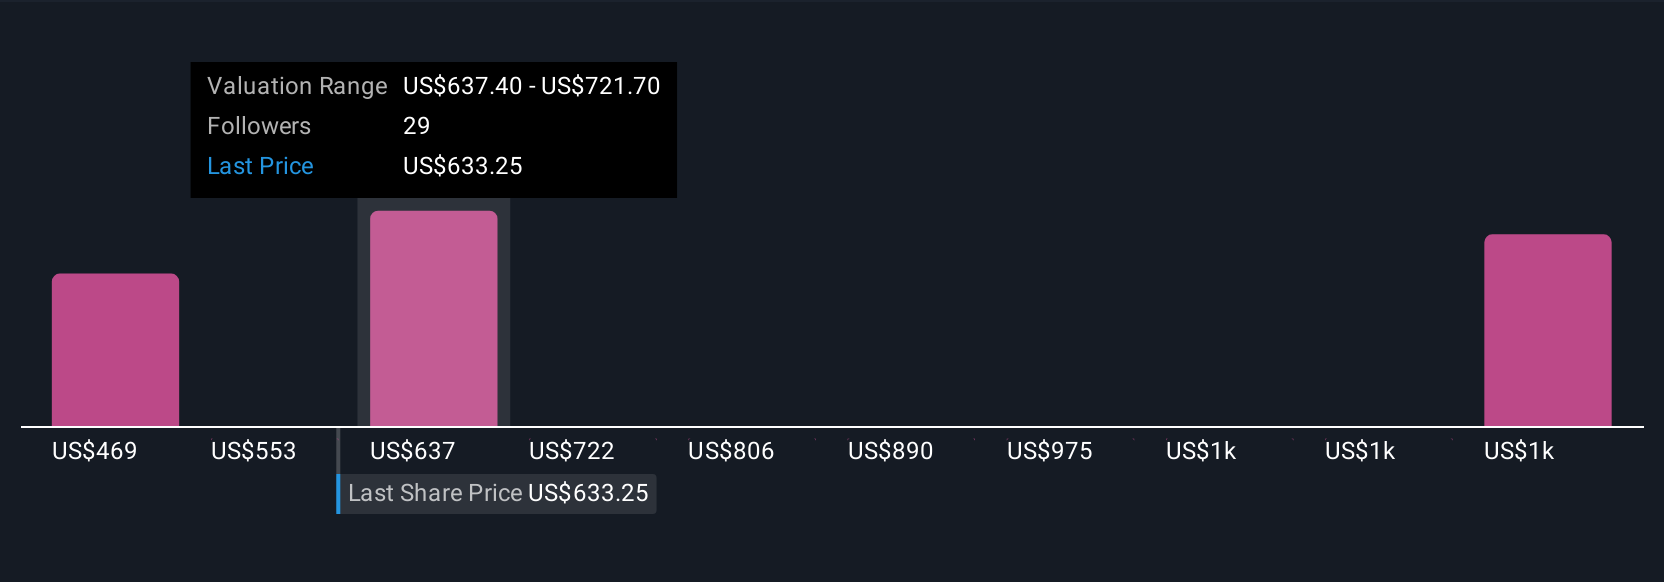
Earlier we mentioned that there is an even better way to understand valuation, so let us introduce you to Narratives. A Narrative is your personal story or thesis for a company like EMCOR Group. It is a way to connect your view of its future (including projected revenue growth, profit margins, and fair value) to the actual business and its financial outlook. Narratives take the numbers and add your perspective, letting you express how you think the company will perform and what it is truly worth.
This approach links the company’s story to a financial forecast and then to a fair value, making it easier to see why you might believe EMCOR is a buy, hold, or sell at today’s price. Narratives are a core feature within Simply Wall St’s Community page, used by millions of investors, and are designed to be simple so anyone can create or follow Narratives with just a few clicks. They help you decide when to act by comparing each Narrative’s Fair Value with the real-time market Price, and are automatically updated as soon as new news or earnings results arrive.
For example, on EMCOR Group, one Narrative assumes strong 9% revenue growth and a fair value of $468.79 per share (more conservative), while another expects higher growth and margins, resulting in a fair value of $681.67. This demonstrates how different investors can hold distinctly different but data-backed perspectives.
For EMCOR Group, we’ll make it really easy for you with previews of two leading EMCOR Group Narratives:
🐂 EMCOR Group Bull CaseFair Value Estimate: $681.67
The current price is 10.7% below this fair value (undervalued).
Revenue Growth Rate Assumed: 9.7%
- Strong sector demand from data centers, healthcare, and manufacturing is fueling a diversified and substantial project backlog. This supports sustained revenue growth and improves long-term margins.
- Strategic acquisitions, investments in talent, and enhanced prefabrication capacity are expected to expand vertical market reach and operational efficiency. These factors help offset labor constraints and boost competitiveness.
- Potential headwinds include persistent labor shortages, cyclical exposure in key segments, M&A integration challenges, and slower adaptation to renewable trends. These issues could affect margins and growth adaptability.
Fair Value Estimate: $468.79
The current price is 29.9% above this fair value (overvalued).
Revenue Growth Rate Assumed: 9%
- Infrastructure investment, electrification trends, and rapid data center expansion provide multi-year growth drivers for EMCOR's core markets and services.
- Risks such as economic slowdowns, labor shortages, and supply chain disruptions could hurt margins and lead to project delays or cancellations.
- Based on projected earnings and a 9% revenue growth forecast, EMCOR appears fairly valued at present. However, investors should be mindful of cyclical and policy risks that could affect future returns.
This article by Simply Wall St is general in nature. We provide commentary based on historical data and analyst forecasts only using an unbiased methodology and our articles are not intended to be financial advice. It does not constitute a recommendation to buy or sell any stock, and does not take account of your objectives, or your financial situation. We aim to bring you long-term focused analysis driven by fundamental data. Note that our analysis may not factor in the latest price-sensitive company announcements or qualitative material. Simply Wall St has no position in any stocks mentioned.
Valuation is complex, but we're here to simplify it.
Discover if EMCOR Group might be undervalued or overvalued with our detailed analysis, featuring fair value estimates, potential risks, dividends, insider trades, and its financial condition.
Access Free AnalysisHave feedback on this article? Concerned about the content? Get in touch with us directly. Alternatively, email editorial-team@simplywallst.com
About NYSE:EME
EMCOR Group
Provides electrical and mechanical construction and facilities, building, and industrial services in the United States and the United Kingdom.
Flawless balance sheet and undervalued.
Similar Companies
Market Insights


Advertisement
Community Narratives
Gaxos.ai: Early-Stage AI Innovator in Gaming & Health
Fair Value US$2.21|6.3% undervalued
JO
Community Contributor
After the AI Party: A Sobering Look at Microsoft's Future
Fair Value US$500.00|0.9% overvalued
PI
Community Contributor
Amazon's Future Rises as Stock Price Falls: A Long-Term Investment Vision
Fair Value US$234.75|2.9% undervalued
ZW
Community Contributor
