- United States
- /
- Electrical
- /
- NYSE:EAF
GrafTech International (NYSE:EAF) May Have Issues Allocating Its Capital


What financial metrics can indicate to us that a company is maturing or even in decline? When we see a declining return on capital employed (ROCE) in conjunction with a declining base of capital employed, that's often how a mature business shows signs of aging. This indicates to us that the business is not only shrinking the size of its net assets, but its returns are falling as well. On that note, looking into GrafTech International (NYSE:EAF), we weren't too upbeat about how things were going.
Return On Capital Employed (ROCE): What Is It?
Just to clarify if you're unsure, ROCE is a metric for evaluating how much pre-tax income (in percentage terms) a company earns on the capital invested in its business. The formula for this calculation on GrafTech International is:
Return on Capital Employed = Earnings Before Interest and Tax (EBIT) ÷ (Total Assets - Current Liabilities)
0.15 = US$199m ÷ (US$1.5b - US$180m) (Based on the trailing twelve months to June 2023).
Therefore, GrafTech International has an ROCE of 15%. In absolute terms, that's a pretty normal return, and it's somewhat close to the Electrical industry average of 13%.
See our latest analysis for GrafTech International
In the above chart we have measured GrafTech International's prior ROCE against its prior performance, but the future is arguably more important. If you'd like, you can check out the forecasts from the analysts covering GrafTech International here for free.
What The Trend Of ROCE Can Tell Us
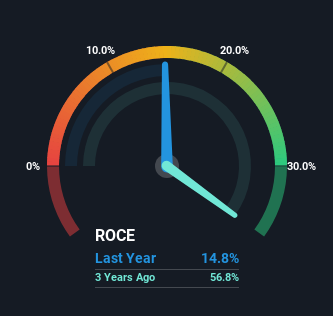
There is reason to be cautious about GrafTech International, given the returns are trending downwards. To be more specific, the ROCE was 47% five years ago, but since then it has dropped noticeably. On top of that, it's worth noting that the amount of capital employed within the business has remained relatively steady. Since returns are falling and the business has the same amount of assets employed, this can suggest it's a mature business that hasn't had much growth in the last five years. If these trends continue, we wouldn't expect GrafTech International to turn into a multi-bagger.
What We Can Learn From GrafTech International's ROCE
All in all, the lower returns from the same amount of capital employed aren't exactly signs of a compounding machine. Unsurprisingly then, the stock has dived 73% over the last five years, so investors are recognizing these changes and don't like the company's prospects. Unless there is a shift to a more positive trajectory in these metrics, we would look elsewhere.
One final note, you should learn about the 3 warning signs we've spotted with GrafTech International (including 1 which is a bit concerning) .
While GrafTech International isn't earning the highest return, check out this free list of companies that are earning high returns on equity with solid balance sheets.
New: Manage All Your Stock Portfolios in One Place
We've created the ultimate portfolio companion for stock investors, and it's free.
• Connect an unlimited number of Portfolios and see your total in one currency
• Be alerted to new Warning Signs or Risks via email or mobile
• Track the Fair Value of your stocks
Have feedback on this article? Concerned about the content? Get in touch with us directly. Alternatively, email editorial-team (at) simplywallst.com.
This article by Simply Wall St is general in nature. We provide commentary based on historical data and analyst forecasts only using an unbiased methodology and our articles are not intended to be financial advice. It does not constitute a recommendation to buy or sell any stock, and does not take account of your objectives, or your financial situation. We aim to bring you long-term focused analysis driven by fundamental data. Note that our analysis may not factor in the latest price-sensitive company announcements or qualitative material. Simply Wall St has no position in any stocks mentioned.
About NYSE:EAF
GrafTech International
Research, develops, manufactures, and sells graphite and carbon-based solutions worldwide.
Fair value low.
