- United States
- /
- Electrical
- /
- NYSE:EAF
GrafTech International Ltd. (NYSE:EAF) Stock's 25% Dive Might Signal An Opportunity But It Requires Some Scrutiny

To the annoyance of some shareholders, GrafTech International Ltd. (NYSE:EAF) shares are down a considerable 25% in the last month, which continues a horrid run for the company. The drop over the last 30 days has capped off a tough year for shareholders, with the share price down 38% in that time.
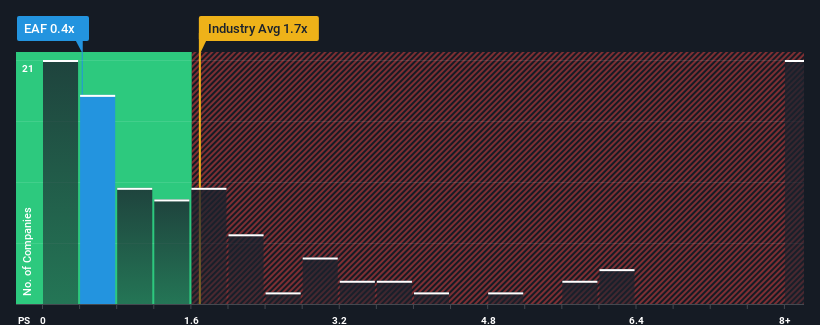
After such a large drop in price, GrafTech International may be sending buy signals at present with its price-to-sales (or "P/S") ratio of 0.4x, considering almost half of all companies in the Electrical industry in the United States have P/S ratios greater than 1.7x and even P/S higher than 5x aren't out of the ordinary. Although, it's not wise to just take the P/S at face value as there may be an explanation why it's limited.
Check out our latest analysis for GrafTech International

How GrafTech International Has Been Performing
GrafTech International hasn't been tracking well recently as its declining revenue compares poorly to other companies, which have seen some growth in their revenues on average. Perhaps the P/S remains low as investors think the prospects of strong revenue growth aren't on the horizon. So while you could say the stock is cheap, investors will be looking for improvement before they see it as good value.
If you'd like to see what analysts are forecasting going forward, you should check out our free report on GrafTech International.Is There Any Revenue Growth Forecasted For GrafTech International?
There's an inherent assumption that a company should underperform the industry for P/S ratios like GrafTech International's to be considered reasonable.
In reviewing the last year of financials, we were disheartened to see the company's revenues fell to the tune of 13%. As a result, revenue from three years ago have also fallen 60% overall. Therefore, it's fair to say the revenue growth recently has been undesirable for the company.
Shifting to the future, estimates from the four analysts covering the company suggest revenue should grow by 21% per annum over the next three years. That's shaping up to be materially higher than the 16% each year growth forecast for the broader industry.
In light of this, it's peculiar that GrafTech International's P/S sits below the majority of other companies. It looks like most investors are not convinced at all that the company can achieve future growth expectations.
What Does GrafTech International's P/S Mean For Investors?
The southerly movements of GrafTech International's shares means its P/S is now sitting at a pretty low level. While the price-to-sales ratio shouldn't be the defining factor in whether you buy a stock or not, it's quite a capable barometer of revenue expectations.
To us, it seems GrafTech International currently trades on a significantly depressed P/S given its forecasted revenue growth is higher than the rest of its industry. There could be some major risk factors that are placing downward pressure on the P/S ratio. It appears the market could be anticipating revenue instability, because these conditions should normally provide a boost to the share price.
It's always necessary to consider the ever-present spectre of investment risk. We've identified 3 warning signs with GrafTech International (at least 2 which shouldn't be ignored), and understanding them should be part of your investment process.
If these risks are making you reconsider your opinion on GrafTech International, explore our interactive list of high quality stocks to get an idea of what else is out there.
If you're looking to trade GrafTech International, open an account with the lowest-cost platform trusted by professionals, Interactive Brokers.
With clients in over 200 countries and territories, and access to 160 markets, IBKR lets you trade stocks, options, futures, forex, bonds and funds from a single integrated account.
Enjoy no hidden fees, no account minimums, and FX conversion rates as low as 0.03%, far better than what most brokers offer.
Sponsored ContentNew: Manage All Your Stock Portfolios in One Place
We've created the ultimate portfolio companion for stock investors, and it's free.
• Connect an unlimited number of Portfolios and see your total in one currency
• Be alerted to new Warning Signs or Risks via email or mobile
• Track the Fair Value of your stocks
Have feedback on this article? Concerned about the content? Get in touch with us directly. Alternatively, email editorial-team (at) simplywallst.com.
This article by Simply Wall St is general in nature. We provide commentary based on historical data and analyst forecasts only using an unbiased methodology and our articles are not intended to be financial advice. It does not constitute a recommendation to buy or sell any stock, and does not take account of your objectives, or your financial situation. We aim to bring you long-term focused analysis driven by fundamental data. Note that our analysis may not factor in the latest price-sensitive company announcements or qualitative material. Simply Wall St has no position in any stocks mentioned.
About NYSE:EAF
GrafTech International
Research, develops, manufactures, and sells graphite and carbon-based solutions worldwide.
Reasonable growth potential and fair value.
Similar Companies
Market Insights
Community Narratives


