Advertisement
- United States
- /
- Construction
- /
- NYSE:DY
Can Dycom Industries Sustain Its 69% Rally After New Broadband Funding Announcement?

Simply Wall St
Reviewed by Bailey Pemberton
If you’re holding Dycom Industries or eyeing its recent impressive rally, you’re not alone in wondering whether this surge is built to last. The stock has turned heads with a gain of 16.9% over the past month and a remarkable 69.1% return year to date. Even looking back, Dycom’s five-year climb of 342.4% feels like the stuff of long-term investor dreams. Naturally, the big question on everyone’s mind is whether this rapid run still leaves room for value, or if the easy money has already been made.
Recent market optimism for infrastructure and broadband expansion has sharpened focus on companies like Dycom, fueling renewed interest from both institutional and retail investors. The stock’s 1.6% lift in the last week might seem modest compared to its bigger streaks, but it adds to a compelling case of consistent momentum. These moves can sometimes reflect shifting risk perceptions as investors appear increasingly willing to place long-term bets on Dycom’s role in the digital buildout.
But let’s get specific: by the numbers, Dycom scores 1 out of 6 in traditional undervaluation checks, suggesting that while there’s ongoing excitement, the stock may not scream “bargain” using the most common yardsticks. That said, numbers only tell part of the story. Next, I’ll break down how different valuation yardsticks view the stock’s prospects and explore why the most meaningful measure of Dycom’s value might just come at the end of our analysis.
Dycom Industries scores just 1/6 on our valuation checks. See what other red flags we found in the full valuation breakdown.
Approach 1: Dycom Industries Discounted Cash Flow (DCF) Analysis
The Discounted Cash Flow (DCF) model estimates a company's intrinsic value by projecting its future free cash flows and discounting them back to today's dollars. This method provides an objective view by focusing on actual cash generated by the business, rather than profits, which can be more easily adjusted on paper.
For Dycom Industries, the latest free cash flow is $130.7 million. Analysts forecast this number to grow, with Simply Wall St extrapolating further beyond five years. By 2027, free cash flow is projected to reach $218.9 million, and the ten-year outlook suggests potential annual cash flows approaching $467.6 million, all still in millions. These escalating forecasts reflect both short-term analyst estimates and longer-term growth assumptions based on Dycom’s historical performance and sector prospects.
The DCF valuation model factors in these projections, discounting each year’s estimated cash flow to its present value and aggregating them for an overall fair value calculation. For Dycom, the resulting intrinsic value is $208.67 per share. Compared to its current market price, this implies the stock is 43.2% overvalued according to the DCF model.
Result: OVERVALUED
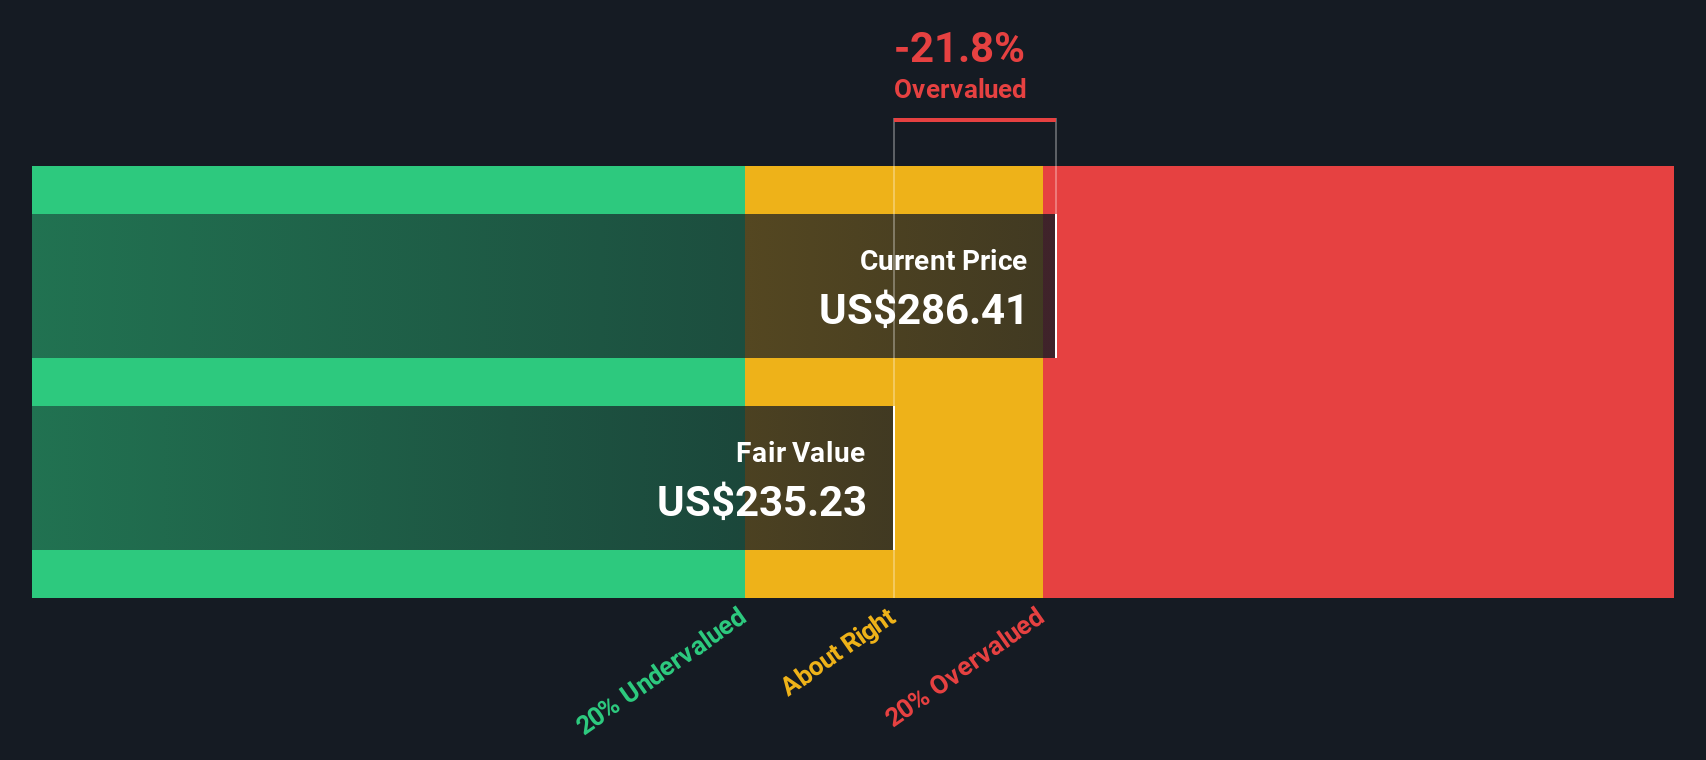
Our Discounted Cash Flow (DCF) analysis suggests Dycom Industries may be overvalued by 43.2%. Find undervalued stocks or create your own screener to find better value opportunities.
Approach 2: Dycom Industries Price vs Earnings (PE) Ratio
The Price-to-Earnings (PE) ratio is a well-regarded valuation tool for profitable companies like Dycom Industries, as it effectively ties a company's share price to its earnings power. For growth stocks in particular, investors are willing to pay a higher PE ratio when they expect future earnings to expand at a faster clip, so growth expectations and perceived risk are key factors in deciding what counts as a “normal” or “fair” PE.
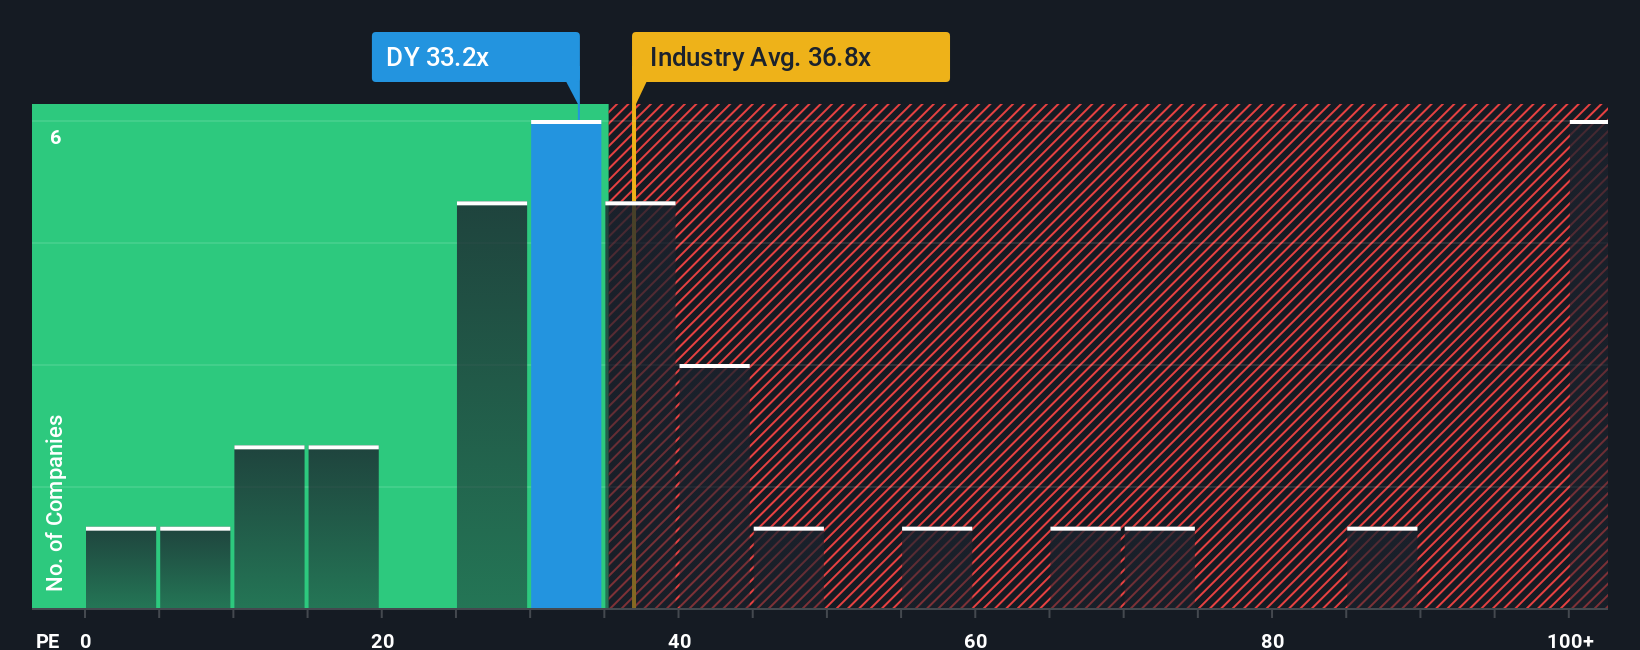
Currently, Dycom Industries trades at a PE ratio of 33x. To put this into context, that is just below the broader Construction industry average of 36.3x but notably higher than the 25.3x average among its closest industry peers. These benchmarks are helpful for an initial comparison, but they do not tell the full story.
This is where Simply Wall St’s “Fair Ratio” comes in, a proprietary calculation that weighs not just the company’s earnings, but also its growth prospects, profit margins, risk profile, industry trends, and relative market cap. For Dycom, the Fair Ratio is calculated at 29.5x, a level below its current multiple of 33x. Because this Fair Ratio incorporates a much wider set of relevant signals than peer averages alone, it offers a more tailored view of whether the stock is trading in line with its prospects and risks.
Given Dycom’s market price is higher than what the Fair Ratio suggests, the stock currently looks somewhat expensive on an earnings basis, though not dramatically so.
Result: OVERVALUED
PE ratios tell one story, but what if the real opportunity lies elsewhere? Discover companies where insiders are betting big on explosive growth.
Upgrade Your Decision Making: Choose your Dycom Industries Narrative
Earlier, we mentioned that there is an even better way to understand valuation, so let's introduce you to Narratives. A Narrative is simply your story about a company, backed up by your own expectations for things like future growth, margins, and risks. Narratives link the company’s big-picture trends to a concrete financial forecast and then to a fair value, helping you see exactly how your outlook translates into a target price. Best of all, Narratives are easy to use and accessible to everyone via Simply Wall St’s Community page, where millions of investors share and update their perspectives in real time.
By comparing your Narrative's fair value with the current market price, you can decide whether now is the right time to buy or sell. Because Narratives are dynamic, they automatically adjust when major news or earnings data comes out. For example, within the Dycom Industries community, some investors believe strong broadband spending and AI infrastructure will sustain double-digit revenue growth and justify a fair value of $304.67. Others focus on risks such as customer concentration and regulatory delays, resulting in a much lower valuation. This approach lets you make decisions with confidence, grounded in both facts and your individual outlook.
Do you think there's more to the story for Dycom Industries? Create your own Narrative to let the Community know!
This article by Simply Wall St is general in nature. We provide commentary based on historical data and analyst forecasts only using an unbiased methodology and our articles are not intended to be financial advice. It does not constitute a recommendation to buy or sell any stock, and does not take account of your objectives, or your financial situation. We aim to bring you long-term focused analysis driven by fundamental data. Note that our analysis may not factor in the latest price-sensitive company announcements or qualitative material. Simply Wall St has no position in any stocks mentioned.
New: Manage All Your Stock Portfolios in One Place
We've created the ultimate portfolio companion for stock investors, and it's free.
• Connect an unlimited number of Portfolios and see your total in one currency
• Be alerted to new Warning Signs or Risks via email or mobile
• Track the Fair Value of your stocks
Have feedback on this article? Concerned about the content? Get in touch with us directly. Alternatively, email editorial-team@simplywallst.com
About NYSE:DY
Dycom Industries
Provides specialty contracting services to the telecommunications infrastructure and utility industries in the United States.
Excellent balance sheet with limited growth.
Similar Companies
Market Insights

Advertisement
Community Narratives
A formidable player in AI and enterprise computing.
Fair Value US$210.00|13.6% overvalued
CO
Community Contributor
IREN's Bold Moves in Sustainable Bitcoin Mining & AI Data Centers
Fair Value US$89.00|23.6% undervalued
BL
Community Contributor
Cooling the Champions: The Aussie Tech Behind F1's Victories
Fair Value AU$12.40|40.6% undervalued
TR
Community Contributor