- United States
- /
- Trade Distributors
- /
- NYSE:BXC
Why Investors Shouldn't Be Surprised By BlueLinx Holdings Inc.'s (NYSE:BXC) 25% Share Price Plunge


Unfortunately for some shareholders, the BlueLinx Holdings Inc. (NYSE:BXC) share price has dived 25% in the last thirty days, prolonging recent pain. The drop over the last 30 days has capped off a tough year for shareholders, with the share price down 33% in that time.
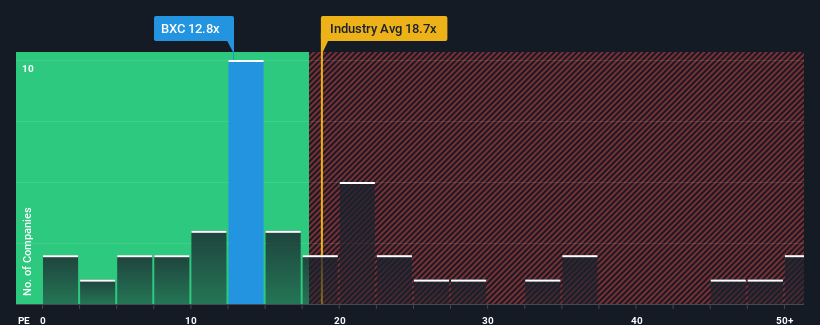
Following the heavy fall in price, BlueLinx Holdings' price-to-earnings (or "P/E") ratio of 12.8x might make it look like a buy right now compared to the market in the United States, where around half of the companies have P/E ratios above 19x and even P/E's above 33x are quite common. Nonetheless, we'd need to dig a little deeper to determine if there is a rational basis for the reduced P/E.
BlueLinx Holdings certainly has been doing a good job lately as it's been growing earnings more than most other companies. One possibility is that the P/E is low because investors think this strong earnings performance might be less impressive moving forward. If you like the company, you'd be hoping this isn't the case so that you could potentially pick up some stock while it's out of favour.
View our latest analysis for BlueLinx Holdings
Is There Any Growth For BlueLinx Holdings?
The only time you'd be truly comfortable seeing a P/E as low as BlueLinx Holdings' is when the company's growth is on track to lag the market.
Retrospectively, the last year delivered a decent 13% gain to the company's bottom line. Still, lamentably EPS has fallen 79% in aggregate from three years ago, which is disappointing. Accordingly, shareholders would have felt downbeat about the medium-term rates of earnings growth.
Turning to the outlook, the next year should bring diminished returns, with earnings decreasing 43% as estimated by the four analysts watching the company. Meanwhile, the broader market is forecast to expand by 14%, which paints a poor picture.
With this information, we are not surprised that BlueLinx Holdings is trading at a P/E lower than the market. Nonetheless, there's no guarantee the P/E has reached a floor yet with earnings going in reverse. Even just maintaining these prices could be difficult to achieve as the weak outlook is weighing down the shares.
The Key Takeaway
BlueLinx Holdings' recently weak share price has pulled its P/E below most other companies. It's argued the price-to-earnings ratio is an inferior measure of value within certain industries, but it can be a powerful business sentiment indicator.
We've established that BlueLinx Holdings maintains its low P/E on the weakness of its forecast for sliding earnings, as expected. At this stage investors feel the potential for an improvement in earnings isn't great enough to justify a higher P/E ratio. Unless these conditions improve, they will continue to form a barrier for the share price around these levels.
Before you take the next step, you should know about the 1 warning sign for BlueLinx Holdings that we have uncovered.
Of course, you might also be able to find a better stock than BlueLinx Holdings. So you may wish to see this free collection of other companies that have reasonable P/E ratios and have grown earnings strongly.
If you're looking to trade BlueLinx Holdings, open an account with the lowest-cost platform trusted by professionals, Interactive Brokers.
With clients in over 200 countries and territories, and access to 160 markets, IBKR lets you trade stocks, options, futures, forex, bonds and funds from a single integrated account.
Enjoy no hidden fees, no account minimums, and FX conversion rates as low as 0.03%, far better than what most brokers offer.
Sponsored ContentValuation is complex, but we're here to simplify it.
Discover if BlueLinx Holdings might be undervalued or overvalued with our detailed analysis, featuring fair value estimates, potential risks, dividends, insider trades, and its financial condition.
Access Free AnalysisHave feedback on this article? Concerned about the content? Get in touch with us directly. Alternatively, email editorial-team (at) simplywallst.com.
This article by Simply Wall St is general in nature. We provide commentary based on historical data and analyst forecasts only using an unbiased methodology and our articles are not intended to be financial advice. It does not constitute a recommendation to buy or sell any stock, and does not take account of your objectives, or your financial situation. We aim to bring you long-term focused analysis driven by fundamental data. Note that our analysis may not factor in the latest price-sensitive company announcements or qualitative material. Simply Wall St has no position in any stocks mentioned.
About NYSE:BXC
BlueLinx Holdings
Engages in the distribution of residential and commercial building products in the United States.
Flawless balance sheet with solid track record.
