
Advertisement
- United States
- /
- Electrical
- /
- NYSE:BE
Bloom Energy Corporation (NYSE:BE) Shares Could Be 34% Above Their Intrinsic Value Estimate
Key Insights
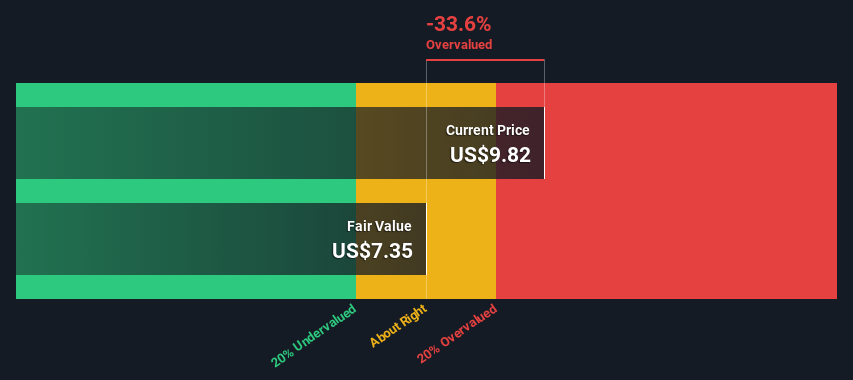
- The projected fair value for Bloom Energy is US$7.35 based on 2 Stage Free Cash Flow to Equity
- Current share price of US$9.82 suggests Bloom Energy is potentially 34% overvalued
- Our fair value estimate is 55% lower than Bloom Energy's analyst price target of US$16.50
Today we will run through one way of estimating the intrinsic value of Bloom Energy Corporation (NYSE:BE) by estimating the company's future cash flows and discounting them to their present value. This will be done using the Discounted Cash Flow (DCF) model. Models like these may appear beyond the comprehension of a lay person, but they're fairly easy to follow.
Remember though, that there are many ways to estimate a company's value, and a DCF is just one method. If you want to learn more about discounted cash flow, the rationale behind this calculation can be read in detail in the Simply Wall St analysis model.
Check out our latest analysis for Bloom Energy
Step By Step Through The Calculation
We're using the 2-stage growth model, which simply means we take in account two stages of company's growth. In the initial period the company may have a higher growth rate and the second stage is usually assumed to have a stable growth rate. To begin with, we have to get estimates of the next ten years of cash flows. Where possible we use analyst estimates, but when these aren't available we extrapolate the previous free cash flow (FCF) from the last estimate or reported value. We assume companies with shrinking free cash flow will slow their rate of shrinkage, and that companies with growing free cash flow will see their growth rate slow, over this period. We do this to reflect that growth tends to slow more in the early years than it does in later years.
A DCF is all about the idea that a dollar in the future is less valuable than a dollar today, so we discount the value of these future cash flows to their estimated value in today's dollars:
10-year free cash flow (FCF) forecast
| 2024 | 2025 | 2026 | 2027 | 2028 | 2029 | 2030 | 2031 | 2032 | 2033 | |
| Levered FCF ($, Millions) | US$148.6m | US$53.3m | -US$75.0m | US$41.0m | US$90.0m | US$112.6m | US$133.2m | US$151.1m | US$166.4m | US$179.3m |
| Growth Rate Estimate Source | Analyst x6 | Analyst x7 | Analyst x1 | Analyst x1 | Analyst x1 | Est @ 25.11% | Est @ 18.27% | Est @ 13.47% | Est @ 10.12% | Est @ 7.77% |
| Present Value ($, Millions) Discounted @ 9.3% | US$136 | US$44.6 | -US$57.5 | US$28.8 | US$57.8 | US$66.2 | US$71.6 | US$74.4 | US$74.9 | US$73.9 |
("Est" = FCF growth rate estimated by Simply Wall St)
Present Value of 10-year Cash Flow (PVCF) = US$571m
The second stage is also known as Terminal Value, this is the business's cash flow after the first stage. The Gordon Growth formula is used to calculate Terminal Value at a future annual growth rate equal to the 5-year average of the 10-year government bond yield of 2.3%. We discount the terminal cash flows to today's value at a cost of equity of 9.3%.
Terminal Value (TV)= FCF2033 × (1 + g) ÷ (r – g) = US$179m× (1 + 2.3%) ÷ (9.3%– 2.3%) = US$2.6b
Present Value of Terminal Value (PVTV)= TV / (1 + r)10= US$2.6b÷ ( 1 + 9.3%)10= US$1.1b
The total value is the sum of cash flows for the next ten years plus the discounted terminal value, which results in the Total Equity Value, which in this case is US$1.7b. The last step is to then divide the equity value by the number of shares outstanding. Relative to the current share price of US$9.8, the company appears reasonably expensive at the time of writing. Remember though, that this is just an approximate valuation, and like any complex formula - garbage in, garbage out.
The Assumptions
Now the most important inputs to a discounted cash flow are the discount rate, and of course, the actual cash flows. Part of investing is coming up with your own evaluation of a company's future performance, so try the calculation yourself and check your own assumptions. The DCF also does not consider the possible cyclicality of an industry, or a company's future capital requirements, so it does not give a full picture of a company's potential performance. Given that we are looking at Bloom Energy as potential shareholders, the cost of equity is used as the discount rate, rather than the cost of capital (or weighted average cost of capital, WACC) which accounts for debt. In this calculation we've used 9.3%, which is based on a levered beta of 1.517. Beta is a measure of a stock's volatility, compared to the market as a whole. We get our beta from the industry average beta of globally comparable companies, with an imposed limit between 0.8 and 2.0, which is a reasonable range for a stable business.
SWOT Analysis for Bloom Energy
Strength
- Debt is well covered by earnings.
Weakness
- Shareholders have been diluted in the past year.
Opportunity
- Forecast to reduce losses next year.
- Good value based on P/S ratio compared to estimated Fair P/S ratio.
Threat
- Debt is not well covered by operating cash flow.
- Has less than 3 years of cash runway based on current free cash flow.
Moving On:
Valuation is only one side of the coin in terms of building your investment thesis, and it is only one of many factors that you need to assess for a company. The DCF model is not a perfect stock valuation tool. Rather it should be seen as a guide to "what assumptions need to be true for this stock to be under/overvalued?" If a company grows at a different rate, or if its cost of equity or risk free rate changes sharply, the output can look very different. Why is the intrinsic value lower than the current share price? For Bloom Energy, there are three relevant factors you should further research:
- Risks: For example, we've discovered 1 warning sign for Bloom Energy that you should be aware of before investing here.
- Management:Have insiders been ramping up their shares to take advantage of the market's sentiment for BE's future outlook? Check out our management and board analysis with insights on CEO compensation and governance factors.
- Other High Quality Alternatives: Do you like a good all-rounder? Explore our interactive list of high quality stocks to get an idea of what else is out there you may be missing!
PS. Simply Wall St updates its DCF calculation for every American stock every day, so if you want to find the intrinsic value of any other stock just search here.
Valuation is complex, but we're here to simplify it.
Discover if Bloom Energy might be undervalued or overvalued with our detailed analysis, featuring fair value estimates, potential risks, dividends, insider trades, and its financial condition.
Access Free AnalysisHave feedback on this article? Concerned about the content? Get in touch with us directly. Alternatively, email editorial-team (at) simplywallst.com.
This article by Simply Wall St is general in nature. We provide commentary based on historical data and analyst forecasts only using an unbiased methodology and our articles are not intended to be financial advice. It does not constitute a recommendation to buy or sell any stock, and does not take account of your objectives, or your financial situation. We aim to bring you long-term focused analysis driven by fundamental data. Note that our analysis may not factor in the latest price-sensitive company announcements or qualitative material. Simply Wall St has no position in any stocks mentioned.
About NYSE:BE
Bloom Energy
Designs, manufactures, sells, and installs solid-oxide fuel cell systems for on-site power generation in the United States and internationally.
High growth potential with mediocre balance sheet.
Similar Companies
Market Insights

Advertisement
Community Narratives
Pinterest will surge as advertising innovations ignite revenue growth
Fair Value US$42.63|27.1% undervalued
BR
Community Contributor
Brambles' Revenue Set to Climb 14% with Profit Margins Following
Fair Value AU$21.90|5.9% overvalued
RO
Community Contributor
Challenging Future for STG as Organic Sales Decline by 8.8%
Fair Value DKK 116.13|26.8% undervalued
KA
Community Contributor