

Key Insights
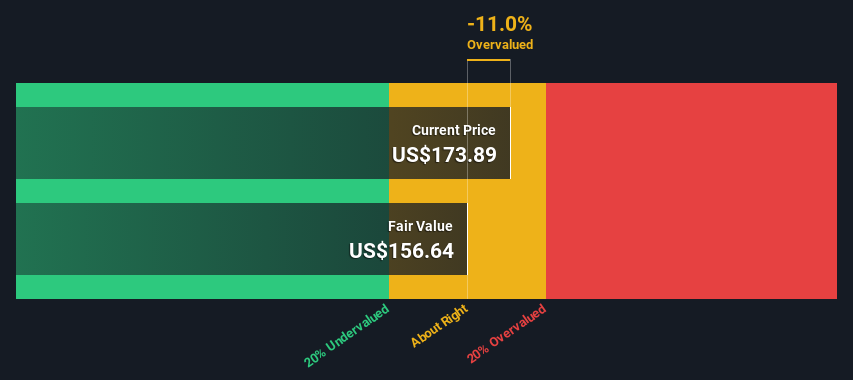
- AMETEK's estimated fair value is US$157 based on 2 Stage Free Cash Flow to Equity
- With US$174 share price, AMETEK appears to be trading close to its estimated fair value
- Our fair value estimate is 14% lower than AMETEK's analyst price target of US$183
Does the February share price for AMETEK, Inc. (NYSE:AME) reflect what it's really worth? Today, we will estimate the stock's intrinsic value by projecting its future cash flows and then discounting them to today's value. One way to achieve this is by employing the Discounted Cash Flow (DCF) model. There's really not all that much to it, even though it might appear quite complex.
We generally believe that a company's value is the present value of all of the cash it will generate in the future. However, a DCF is just one valuation metric among many, and it is not without flaws. Anyone interested in learning a bit more about intrinsic value should have a read of the Simply Wall St analysis model.
See our latest analysis for AMETEK
The Calculation
We use what is known as a 2-stage model, which simply means we have two different periods of growth rates for the company's cash flows. Generally the first stage is higher growth, and the second stage is a lower growth phase. In the first stage we need to estimate the cash flows to the business over the next ten years. Where possible we use analyst estimates, but when these aren't available we extrapolate the previous free cash flow (FCF) from the last estimate or reported value. We assume companies with shrinking free cash flow will slow their rate of shrinkage, and that companies with growing free cash flow will see their growth rate slow, over this period. We do this to reflect that growth tends to slow more in the early years than it does in later years.
Generally we assume that a dollar today is more valuable than a dollar in the future, so we need to discount the sum of these future cash flows to arrive at a present value estimate:
10-year free cash flow (FCF) estimate
| 2024 | 2025 | 2026 | 2027 | 2028 | 2029 | 2030 | 2031 | 2032 | 2033 | |
| Levered FCF ($, Millions) | US$1.63b | US$1.78b | US$1.89b | US$1.98b | US$2.06b | US$2.13b | US$2.20b | US$2.26b | US$2.32b | US$2.38b |
| Growth Rate Estimate Source | Analyst x7 | Analyst x6 | Analyst x1 | Est @ 4.75% | Est @ 4.01% | Est @ 3.50% | Est @ 3.13% | Est @ 2.88% | Est @ 2.70% | Est @ 2.58% |
| Present Value ($, Millions) Discounted @ 7.6% | US$1.5k | US$1.5k | US$1.5k | US$1.5k | US$1.4k | US$1.4k | US$1.3k | US$1.3k | US$1.2k | US$1.2k |
("Est" = FCF growth rate estimated by Simply Wall St)
Present Value of 10-year Cash Flow (PVCF) = US$14b
We now need to calculate the Terminal Value, which accounts for all the future cash flows after this ten year period. For a number of reasons a very conservative growth rate is used that cannot exceed that of a country's GDP growth. In this case we have used the 5-year average of the 10-year government bond yield (2.3%) to estimate future growth. In the same way as with the 10-year 'growth' period, we discount future cash flows to today's value, using a cost of equity of 7.6%.
Terminal Value (TV)= FCF2033 × (1 + g) ÷ (r – g) = US$2.4b× (1 + 2.3%) ÷ (7.6%– 2.3%) = US$46b
Present Value of Terminal Value (PVTV)= TV / (1 + r)10= US$46b÷ ( 1 + 7.6%)10= US$22b
The total value is the sum of cash flows for the next ten years plus the discounted terminal value, which results in the Total Equity Value, which in this case is US$36b. To get the intrinsic value per share, we divide this by the total number of shares outstanding. Compared to the current share price of US$174, the company appears around fair value at the time of writing. Remember though, that this is just an approximate valuation, and like any complex formula - garbage in, garbage out.
The Assumptions
We would point out that the most important inputs to a discounted cash flow are the discount rate and of course the actual cash flows. You don't have to agree with these inputs, I recommend redoing the calculations yourself and playing with them. The DCF also does not consider the possible cyclicality of an industry, or a company's future capital requirements, so it does not give a full picture of a company's potential performance. Given that we are looking at AMETEK as potential shareholders, the cost of equity is used as the discount rate, rather than the cost of capital (or weighted average cost of capital, WACC) which accounts for debt. In this calculation we've used 7.6%, which is based on a levered beta of 1.145. Beta is a measure of a stock's volatility, compared to the market as a whole. We get our beta from the industry average beta of globally comparable companies, with an imposed limit between 0.8 and 2.0, which is a reasonable range for a stable business.
SWOT Analysis for AMETEK
- Earnings growth over the past year exceeded its 5-year average.
- Debt is not viewed as a risk.
- Earnings growth over the past year underperformed the Electrical industry.
- Dividend is low compared to the top 25% of dividend payers in the Electrical market.
- Expensive based on P/E ratio and estimated fair value.
- Annual earnings are forecast to grow for the next 3 years.
- Annual earnings are forecast to grow slower than the American market.
Next Steps:
Whilst important, the DCF calculation shouldn't be the only metric you look at when researching a company. It's not possible to obtain a foolproof valuation with a DCF model. Rather it should be seen as a guide to "what assumptions need to be true for this stock to be under/overvalued?" If a company grows at a different rate, or if its cost of equity or risk free rate changes sharply, the output can look very different. For AMETEK, we've compiled three pertinent items you should further research:
- Financial Health: Does AME have a healthy balance sheet? Take a look at our free balance sheet analysis with six simple checks on key factors like leverage and risk.
- Future Earnings: How does AME's growth rate compare to its peers and the wider market? Dig deeper into the analyst consensus number for the upcoming years by interacting with our free analyst growth expectation chart.
- Other High Quality Alternatives: Do you like a good all-rounder? Explore our interactive list of high quality stocks to get an idea of what else is out there you may be missing!
PS. The Simply Wall St app conducts a discounted cash flow valuation for every stock on the NYSE every day. If you want to find the calculation for other stocks just search here.
New: Manage All Your Stock Portfolios in One Place
We've created the ultimate portfolio companion for stock investors, and it's free.
• Connect an unlimited number of Portfolios and see your total in one currency
• Be alerted to new Warning Signs or Risks via email or mobile
• Track the Fair Value of your stocks
Have feedback on this article? Concerned about the content? Get in touch with us directly. Alternatively, email editorial-team (at) simplywallst.com.
This article by Simply Wall St is general in nature. We provide commentary based on historical data and analyst forecasts only using an unbiased methodology and our articles are not intended to be financial advice. It does not constitute a recommendation to buy or sell any stock, and does not take account of your objectives, or your financial situation. We aim to bring you long-term focused analysis driven by fundamental data. Note that our analysis may not factor in the latest price-sensitive company announcements or qualitative material. Simply Wall St has no position in any stocks mentioned.
About NYSE:AME
AMETEK
Manufactures and sells electronic instruments and electromechanical devices in the North America, Europe, Asia, and South America, and internationally.
Excellent balance sheet with questionable track record.
