- United States
- /
- Aerospace & Defense
- /
- NYSE:ACHR
Is Archer Aviation Inc. (NYSE:ACHR) Expensive For A Reason? A Look At Its Intrinsic Value


Key Insights
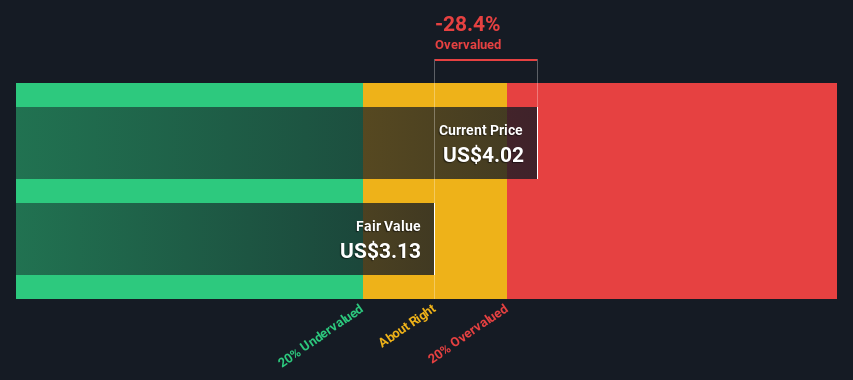
- Archer Aviation's estimated fair value is US$3.13 based on 2 Stage Free Cash Flow to Equity
- Current share price of US$4.02 suggests Archer Aviation is potentially 28% overvalued
- The US$8.79 analyst price target for ACHR is 181% more than our estimate of fair value
In this article we are going to estimate the intrinsic value of Archer Aviation Inc. (NYSE:ACHR) by estimating the company's future cash flows and discounting them to their present value. This will be done using the Discounted Cash Flow (DCF) model. Don't get put off by the jargon, the math behind it is actually quite straightforward.
We would caution that there are many ways of valuing a company and, like the DCF, each technique has advantages and disadvantages in certain scenarios. If you want to learn more about discounted cash flow, the rationale behind this calculation can be read in detail in the Simply Wall St analysis model.
See our latest analysis for Archer Aviation
Crunching The Numbers
We're using the 2-stage growth model, which simply means we take in account two stages of company's growth. In the initial period the company may have a higher growth rate and the second stage is usually assumed to have a stable growth rate. In the first stage we need to estimate the cash flows to the business over the next ten years. Where possible we use analyst estimates, but when these aren't available we extrapolate the previous free cash flow (FCF) from the last estimate or reported value. We assume companies with shrinking free cash flow will slow their rate of shrinkage, and that companies with growing free cash flow will see their growth rate slow, over this period. We do this to reflect that growth tends to slow more in the early years than it does in later years.
Generally we assume that a dollar today is more valuable than a dollar in the future, and so the sum of these future cash flows is then discounted to today's value:
10-year free cash flow (FCF) estimate
| 2025 | 2026 | 2027 | 2028 | 2029 | 2030 | 2031 | 2032 | 2033 | 2034 | |
| Levered FCF ($, Millions) | -US$321.3m | -US$431.3m | -US$45.0m | US$23.5m | US$35.1m | US$47.4m | US$59.4m | US$70.4m | US$80.1m | US$88.4m |
| Growth Rate Estimate Source | Analyst x5 | Analyst x3 | Analyst x2 | Analyst x2 | Est @ 49.19% | Est @ 35.18% | Est @ 25.38% | Est @ 18.51% | Est @ 13.71% | Est @ 10.35% |
| Present Value ($, Millions) Discounted @ 5.8% | -US$304 | -US$385 | -US$37.9 | US$18.7 | US$26.4 | US$33.7 | US$39.9 | US$44.7 | US$48.0 | US$50.1 |
("Est" = FCF growth rate estimated by Simply Wall St)
Present Value of 10-year Cash Flow (PVCF) = -US$465m
We now need to calculate the Terminal Value, which accounts for all the future cash flows after this ten year period. The Gordon Growth formula is used to calculate Terminal Value at a future annual growth rate equal to the 5-year average of the 10-year government bond yield of 2.5%. We discount the terminal cash flows to today's value at a cost of equity of 5.8%.
Terminal Value (TV)= FCF2034 × (1 + g) ÷ (r – g) = US$88m× (1 + 2.5%) ÷ (5.8%– 2.5%) = US$2.7b
Present Value of Terminal Value (PVTV)= TV / (1 + r)10= US$2.7b÷ ( 1 + 5.8%)10= US$1.5b
The total value, or equity value, is then the sum of the present value of the future cash flows, which in this case is US$1.1b. To get the intrinsic value per share, we divide this by the total number of shares outstanding. Relative to the current share price of US$4.0, the company appears slightly overvalued at the time of writing. The assumptions in any calculation have a big impact on the valuation, so it is better to view this as a rough estimate, not precise down to the last cent.
Important Assumptions
We would point out that the most important inputs to a discounted cash flow are the discount rate and of course the actual cash flows. If you don't agree with these result, have a go at the calculation yourself and play with the assumptions. The DCF also does not consider the possible cyclicality of an industry, or a company's future capital requirements, so it does not give a full picture of a company's potential performance. Given that we are looking at Archer Aviation as potential shareholders, the cost of equity is used as the discount rate, rather than the cost of capital (or weighted average cost of capital, WACC) which accounts for debt. In this calculation we've used 5.8%, which is based on a levered beta of 0.813. Beta is a measure of a stock's volatility, compared to the market as a whole. We get our beta from the industry average beta of globally comparable companies, with an imposed limit between 0.8 and 2.0, which is a reasonable range for a stable business.
SWOT Analysis for Archer Aviation
- Debt is well covered by earnings.
- Current share price is above our estimate of fair value.
- Shareholders have been diluted in the past year.
- ACHR's financial characteristics indicate limited near-term opportunities for shareholders.
- Debt is not well covered by operating cash flow.
- Has less than 3 years of cash runway based on current free cash flow.
- Not expected to become profitable over the next 3 years.
Next Steps:
Whilst important, the DCF calculation is only one of many factors that you need to assess for a company. DCF models are not the be-all and end-all of investment valuation. Rather it should be seen as a guide to "what assumptions need to be true for this stock to be under/overvalued?" If a company grows at a different rate, or if its cost of equity or risk free rate changes sharply, the output can look very different. Can we work out why the company is trading at a premium to intrinsic value? For Archer Aviation, we've put together three further items you should look at:
- Risks: To that end, you should learn about the 5 warning signs we've spotted with Archer Aviation (including 2 which don't sit too well with us) .
- Future Earnings: How does ACHR's growth rate compare to its peers and the wider market? Dig deeper into the analyst consensus number for the upcoming years by interacting with our free analyst growth expectation chart.
- Other Solid Businesses: Low debt, high returns on equity and good past performance are fundamental to a strong business. Why not explore our interactive list of stocks with solid business fundamentals to see if there are other companies you may not have considered!
PS. Simply Wall St updates its DCF calculation for every American stock every day, so if you want to find the intrinsic value of any other stock just search here.
New: Manage All Your Stock Portfolios in One Place
We've created the ultimate portfolio companion for stock investors, and it's free.
• Connect an unlimited number of Portfolios and see your total in one currency
• Be alerted to new Warning Signs or Risks via email or mobile
• Track the Fair Value of your stocks
Have feedback on this article? Concerned about the content? Get in touch with us directly. Alternatively, email editorial-team (at) simplywallst.com.
This article by Simply Wall St is general in nature. We provide commentary based on historical data and analyst forecasts only using an unbiased methodology and our articles are not intended to be financial advice. It does not constitute a recommendation to buy or sell any stock, and does not take account of your objectives, or your financial situation. We aim to bring you long-term focused analysis driven by fundamental data. Note that our analysis may not factor in the latest price-sensitive company announcements or qualitative material. Simply Wall St has no position in any stocks mentioned.
Have feedback on this article? Concerned about the content? Get in touch with us directly. Alternatively, email editorial-team@simplywallst.com
About NYSE:ACHR
Archer Aviation
Engages in designs, develops, and operates electric vertical takeoff and landing aircraft for use in urban air mobility.
Excellent balance sheet moderate.
Similar Companies
Market Insights

Community Narratives

