
Advertisement

Warren Buffett famously said, 'Volatility is far from synonymous with risk.' It's only natural to consider a company's balance sheet when you examine how risky it is, since debt is often involved when a business collapses. We can see that UFP Industries, Inc. (NASDAQ:UFPI) does use debt in its business. But the more important question is: how much risk is that debt creating?
When Is Debt Dangerous?
Debt is a tool to help businesses grow, but if a business is incapable of paying off its lenders, then it exists at their mercy. In the worst case scenario, a company can go bankrupt if it cannot pay its creditors. However, a more usual (but still expensive) situation is where a company must dilute shareholders at a cheap share price simply to get debt under control. Having said that, the most common situation is where a company manages its debt reasonably well - and to its own advantage. The first step when considering a company's debt levels is to consider its cash and debt together.
View our latest analysis for UFP Industries
What Is UFP Industries's Debt?
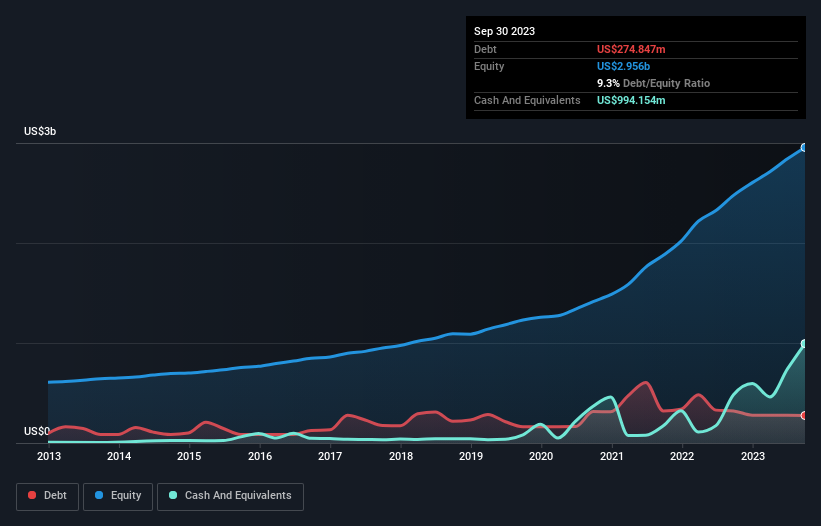
As you can see below, UFP Industries had US$274.8m of debt at September 2023, down from US$321.1m a year prior. However, its balance sheet shows it holds US$994.2m in cash, so it actually has US$719.3m net cash.
How Healthy Is UFP Industries' Balance Sheet?
The latest balance sheet data shows that UFP Industries had liabilities of US$601.8m due within a year, and liabilities of US$446.7m falling due after that. On the other hand, it had cash of US$994.2m and US$725.7m worth of receivables due within a year. So it actually has US$671.3m more liquid assets than total liabilities.
This short term liquidity is a sign that UFP Industries could probably pay off its debt with ease, as its balance sheet is far from stretched. Succinctly put, UFP Industries boasts net cash, so it's fair to say it does not have a heavy debt load!
It is just as well that UFP Industries's load is not too heavy, because its EBIT was down 29% over the last year. When it comes to paying off debt, falling earnings are no more useful than sugary sodas are for your health. The balance sheet is clearly the area to focus on when you are analysing debt. But it is future earnings, more than anything, that will determine UFP Industries's ability to maintain a healthy balance sheet going forward. So if you're focused on the future you can check out this free report showing analyst profit forecasts.
Finally, while the tax-man may adore accounting profits, lenders only accept cold hard cash. While UFP Industries has net cash on its balance sheet, it's still worth taking a look at its ability to convert earnings before interest and tax (EBIT) to free cash flow, to help us understand how quickly it is building (or eroding) that cash balance. Over the most recent three years, UFP Industries recorded free cash flow worth 75% of its EBIT, which is around normal, given free cash flow excludes interest and tax. This cold hard cash means it can reduce its debt when it wants to.
Summing Up
While it is always sensible to investigate a company's debt, in this case UFP Industries has US$719.3m in net cash and a decent-looking balance sheet. And it impressed us with free cash flow of US$819m, being 75% of its EBIT. So we are not troubled with UFP Industries's debt use. When analysing debt levels, the balance sheet is the obvious place to start. But ultimately, every company can contain risks that exist outside of the balance sheet. For instance, we've identified 1 warning sign for UFP Industries that you should be aware of.
At the end of the day, it's often better to focus on companies that are free from net debt. You can access our special list of such companies (all with a track record of profit growth). It's free.
New: AI Stock Screener & Alerts
Our new AI Stock Screener scans the market every day to uncover opportunities.
• Dividend Powerhouses (3%+ Yield)
• Undervalued Small Caps with Insider Buying
• High growth Tech and AI Companies
Or build your own from over 50 metrics.
Have feedback on this article? Concerned about the content? Get in touch with us directly. Alternatively, email editorial-team (at) simplywallst.com.
This article by Simply Wall St is general in nature. We provide commentary based on historical data and analyst forecasts only using an unbiased methodology and our articles are not intended to be financial advice. It does not constitute a recommendation to buy or sell any stock, and does not take account of your objectives, or your financial situation. We aim to bring you long-term focused analysis driven by fundamental data. Note that our analysis may not factor in the latest price-sensitive company announcements or qualitative material. Simply Wall St has no position in any stocks mentioned.
About NasdaqGS:UFPI
UFP Industries
Designs, manufactures, and supplies wood and non-wood composites, and other materials in the United States and internationally.
Flawless balance sheet, good value and pays a dividend.
Similar Companies
Market Insights


Advertisement
Community Narratives
Nike's Direct-to-Consumer Focus Will Drive Future Growth
Fair Value US$87.90|18.2% undervalued
UN
Community Contributor
Novo Nordisk will dominate GLP-1 market with Ozempic and Wegovy growth
Fair Value US$89.59|12.1% undervalued
BE
Community Contributor
Rheinmetall could get 20-25% of EU-NATO 3%-GDP defence spending
Fair Value €7.57k|82.4% undervalued
NO
Community Contributor