- United States
- /
- Electrical
- /
- NasdaqCM:FTCI
FTC Solar, Inc. (NASDAQ:FTCI) Stock Catapults 82% Though Its Price And Business Still Lag The Industry

FTC Solar, Inc. (NASDAQ:FTCI) shareholders are no doubt pleased to see that the share price has bounced 82% in the last month, although it is still struggling to make up recently lost ground. Still, the 30-day jump doesn't change the fact that longer term shareholders have seen their stock decimated by the 62% share price drop in the last twelve months.
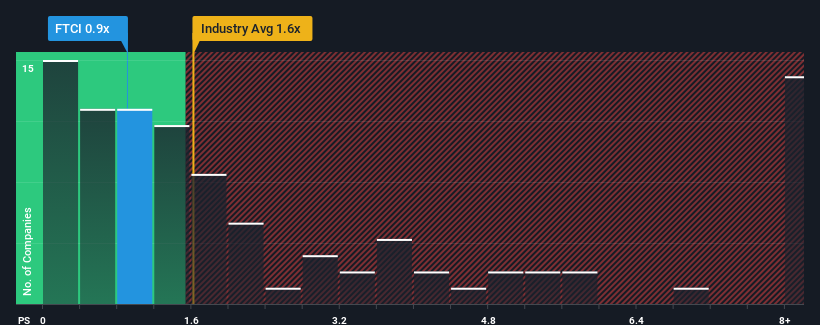
In spite of the firm bounce in price, FTC Solar's price-to-sales (or "P/S") ratio of 0.9x might still make it look like a buy right now compared to the Electrical industry in the United States, where around half of the companies have P/S ratios above 1.6x and even P/S above 4x are quite common. Nonetheless, we'd need to dig a little deeper to determine if there is a rational basis for the reduced P/S.
View our latest analysis for FTC Solar

What Does FTC Solar's Recent Performance Look Like?
FTC Solar hasn't been tracking well recently as its declining revenue compares poorly to other companies, which have seen some growth in their revenues on average. Perhaps the P/S remains low as investors think the prospects of strong revenue growth aren't on the horizon. So while you could say the stock is cheap, investors will be looking for improvement before they see it as good value.
Keen to find out how analysts think FTC Solar's future stacks up against the industry? In that case, our free report is a great place to start.What Are Revenue Growth Metrics Telling Us About The Low P/S?
FTC Solar's P/S ratio would be typical for a company that's only expected to deliver limited growth, and importantly, perform worse than the industry.
Retrospectively, the last year delivered a frustrating 35% decrease to the company's top line. This means it has also seen a slide in revenue over the longer-term as revenue is down 31% in total over the last three years. Accordingly, shareholders would have felt downbeat about the medium-term rates of revenue growth.
Shifting to the future, estimates from the seven analysts covering the company suggest revenue should grow by 53% per year over the next three years. With the industry predicted to deliver 70% growth per annum, the company is positioned for a weaker revenue result.
With this information, we can see why FTC Solar is trading at a P/S lower than the industry. Apparently many shareholders weren't comfortable holding on while the company is potentially eyeing a less prosperous future.
The Bottom Line On FTC Solar's P/S
Despite FTC Solar's share price climbing recently, its P/S still lags most other companies. We'd say the price-to-sales ratio's power isn't primarily as a valuation instrument but rather to gauge current investor sentiment and future expectations.
As we suspected, our examination of FTC Solar's analyst forecasts revealed that its inferior revenue outlook is contributing to its low P/S. Right now shareholders are accepting the low P/S as they concede future revenue probably won't provide any pleasant surprises. It's hard to see the share price rising strongly in the near future under these circumstances.
Having said that, be aware FTC Solar is showing 3 warning signs in our investment analysis, and 1 of those is a bit unpleasant.
It's important to make sure you look for a great company, not just the first idea you come across. So if growing profitability aligns with your idea of a great company, take a peek at this free list of interesting companies with strong recent earnings growth (and a low P/E).
New: AI Stock Screener & Alerts
Our new AI Stock Screener scans the market every day to uncover opportunities.
• Dividend Powerhouses (3%+ Yield)
• Undervalued Small Caps with Insider Buying
• High growth Tech and AI Companies
Or build your own from over 50 metrics.
Have feedback on this article? Concerned about the content? Get in touch with us directly. Alternatively, email editorial-team (at) simplywallst.com.
This article by Simply Wall St is general in nature. We provide commentary based on historical data and analyst forecasts only using an unbiased methodology and our articles are not intended to be financial advice. It does not constitute a recommendation to buy or sell any stock, and does not take account of your objectives, or your financial situation. We aim to bring you long-term focused analysis driven by fundamental data. Note that our analysis may not factor in the latest price-sensitive company announcements or qualitative material. Simply Wall St has no position in any stocks mentioned.
About NasdaqCM:FTCI
FTC Solar
Engages in the provision of solar tracker systems, software, and engineering services in the United States, Asia, Europe, the Middle East, North Africa, South Africa, and Australia.
High growth potential with excellent balance sheet.

