

We can readily understand why investors are attracted to unprofitable companies. For example, although software-as-a-service business Salesforce.com lost money for years while it grew recurring revenue, if you held shares since 2005, you'd have done very well indeed. But while the successes are well known, investors should not ignore the very many unprofitable companies that simply burn through all their cash and collapse.
So, the natural question for FTC Solar (NASDAQ:FTCI) shareholders is whether they should be concerned by its rate of cash burn. In this report, we will consider the company's annual negative free cash flow, henceforth referring to it as the 'cash burn'. The first step is to compare its cash burn with its cash reserves, to give us its 'cash runway'.
See our latest analysis for FTC Solar
How Long Is FTC Solar's Cash Runway?
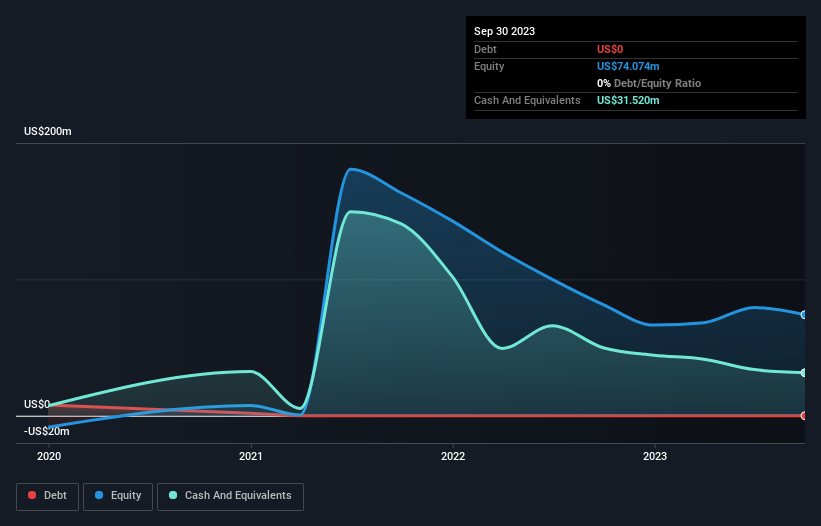
A company's cash runway is the amount of time it would take to burn through its cash reserves at its current cash burn rate. When FTC Solar last reported its balance sheet in September 2023, it had zero debt and cash worth US$32m. Importantly, its cash burn was US$52m over the trailing twelve months. Therefore, from September 2023 it had roughly 7 months of cash runway. Importantly, analysts think that FTC Solar will reach cashflow breakeven in 3 years. Essentially, that means the company will either reduce its cash burn, or else require more cash. You can see how its cash balance has changed over time in the image below.
How Well Is FTC Solar Growing?
We reckon the fact that FTC Solar managed to shrink its cash burn by 42% over the last year is rather encouraging. But the revenue dip of 35% in the same period was a bit concerning. In light of the data above, we're fairly sanguine about the business growth trajectory. While the past is always worth studying, it is the future that matters most of all. For that reason, it makes a lot of sense to take a look at our analyst forecasts for the company.
How Hard Would It Be For FTC Solar To Raise More Cash For Growth?
Given FTC Solar's revenue is receding, there's a considerable chance it will eventually need to raise more money to spend on driving growth. Companies can raise capital through either debt or equity. One of the main advantages held by publicly listed companies is that they can sell shares to investors to raise cash and fund growth. By comparing a company's annual cash burn to its total market capitalisation, we can estimate roughly how many shares it would have to issue in order to run the company for another year (at the same burn rate).
FTC Solar has a market capitalisation of US$71m and burnt through US$52m last year, which is 74% of the company's market value. Given how large that cash burn is, relative to the market value of the entire company, we'd consider it to be a high risk stock, with the real possibility of extreme dilution.
How Risky Is FTC Solar's Cash Burn Situation?
Even though its cash burn relative to its market cap makes us a little nervous, we are compelled to mention that we thought FTC Solar's cash burn reduction was relatively promising. Shareholders can take heart from the fact that analysts are forecasting it will reach breakeven. After looking at that range of measures, we think shareholders should be extremely attentive to how the company is using its cash, as the cash burn makes us uncomfortable. Separately, we looked at different risks affecting the company and spotted 4 warning signs for FTC Solar (of which 1 shouldn't be ignored!) you should know about.
Of course FTC Solar may not be the best stock to buy. So you may wish to see this free collection of companies boasting high return on equity, or this list of stocks that insiders are buying.
New: AI Stock Screener & Alerts
Our new AI Stock Screener scans the market every day to uncover opportunities.
• Dividend Powerhouses (3%+ Yield)
• Undervalued Small Caps with Insider Buying
• High growth Tech and AI Companies
Or build your own from over 50 metrics.
Have feedback on this article? Concerned about the content? Get in touch with us directly. Alternatively, email editorial-team (at) simplywallst.com.
This article by Simply Wall St is general in nature. We provide commentary based on historical data and analyst forecasts only using an unbiased methodology and our articles are not intended to be financial advice. It does not constitute a recommendation to buy or sell any stock, and does not take account of your objectives, or your financial situation. We aim to bring you long-term focused analysis driven by fundamental data. Note that our analysis may not factor in the latest price-sensitive company announcements or qualitative material. Simply Wall St has no position in any stocks mentioned.
About NasdaqCM:FTCI
FTC Solar
Engages in the provision of solar tracker systems, software, and engineering services in the United States, Asia, Europe, the Middle East, North Africa, South Africa, and Australia.
High growth potential with excellent balance sheet.

