- United States
- /
- Machinery
- /
- NasdaqGM:BLBD
Capital Allocation Trends At Blue Bird (NASDAQ:BLBD) Aren't Ideal


If you're looking for a multi-bagger, there's a few things to keep an eye out for. Firstly, we'd want to identify a growing return on capital employed (ROCE) and then alongside that, an ever-increasing base of capital employed. Put simply, these types of businesses are compounding machines, meaning they are continually reinvesting their earnings at ever-higher rates of return. However, after investigating Blue Bird (NASDAQ:BLBD), we don't think it's current trends fit the mold of a multi-bagger.
What is Return On Capital Employed (ROCE)?
For those who don't know, ROCE is a measure of a company's yearly pre-tax profit (its return), relative to the capital employed in the business. To calculate this metric for Blue Bird, this is the formula:
Return on Capital Employed = Earnings Before Interest and Tax (EBIT) ÷ (Total Assets - Current Liabilities)
0.041 = US$10m ÷ (US$364m - US$112m) (Based on the trailing twelve months to January 2022).
Thus, Blue Bird has an ROCE of 4.1%. Ultimately, that's a low return and it under-performs the Machinery industry average of 10%.
Check out our latest analysis for Blue Bird
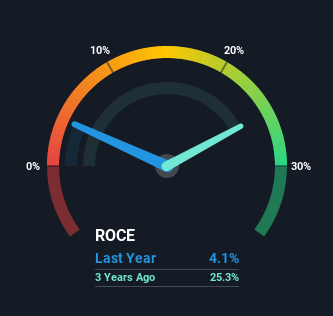
Above you can see how the current ROCE for Blue Bird compares to its prior returns on capital, but there's only so much you can tell from the past. If you'd like, you can check out the forecasts from the analysts covering Blue Bird here for free.
So How Is Blue Bird's ROCE Trending?
We weren't thrilled with the trend because Blue Bird's ROCE has reduced by 86% over the last five years, while the business employed 71% more capital. That being said, Blue Bird raised some capital prior to their latest results being released, so that could partly explain the increase in capital employed. It's unlikely that all of the funds raised have been put to work yet, so as a consequence Blue Bird might not have received a full period of earnings contribution from it.
On a related note, Blue Bird has decreased its current liabilities to 31% of total assets. That could partly explain why the ROCE has dropped. Effectively this means their suppliers or short-term creditors are funding less of the business, which reduces some elements of risk. Some would claim this reduces the business' efficiency at generating ROCE since it is now funding more of the operations with its own money.
In Conclusion...
We're a bit apprehensive about Blue Bird because despite more capital being deployed in the business, returns on that capital and sales have both fallen. In spite of that, the stock has delivered a 27% return to shareholders who held over the last five years. Regardless, we don't like the trends as they are and if they persist, we think you might find better investments elsewhere.
If you want to know some of the risks facing Blue Bird we've found 3 warning signs (1 is a bit unpleasant!) that you should be aware of before investing here.
While Blue Bird isn't earning the highest return, check out this free list of companies that are earning high returns on equity with solid balance sheets.
If you're looking to trade Blue Bird, open an account with the lowest-cost platform trusted by professionals, Interactive Brokers.
With clients in over 200 countries and territories, and access to 160 markets, IBKR lets you trade stocks, options, futures, forex, bonds and funds from a single integrated account.
Enjoy no hidden fees, no account minimums, and FX conversion rates as low as 0.03%, far better than what most brokers offer.
Sponsored ContentValuation is complex, but we're here to simplify it.
Discover if Blue Bird might be undervalued or overvalued with our detailed analysis, featuring fair value estimates, potential risks, dividends, insider trades, and its financial condition.
Access Free AnalysisHave feedback on this article? Concerned about the content? Get in touch with us directly. Alternatively, email editorial-team (at) simplywallst.com.
This article by Simply Wall St is general in nature. We provide commentary based on historical data and analyst forecasts only using an unbiased methodology and our articles are not intended to be financial advice. It does not constitute a recommendation to buy or sell any stock, and does not take account of your objectives, or your financial situation. We aim to bring you long-term focused analysis driven by fundamental data. Note that our analysis may not factor in the latest price-sensitive company announcements or qualitative material. Simply Wall St has no position in any stocks mentioned.
About NasdaqGM:BLBD
Blue Bird
Designs, engineers, manufactures, and sells school buses in the United States, Canada, and internationally.
Flawless balance sheet and undervalued.
Similar Companies
Market Insights

Community Narratives

