

Howard Marks put it nicely when he said that, rather than worrying about share price volatility, 'The possibility of permanent loss is the risk I worry about... and every practical investor I know worries about.' When we think about how risky a company is, we always like to look at its use of debt, since debt overload can lead to ruin. Importantly, AAON, Inc. (NASDAQ:AAON) does carry debt. But the more important question is: how much risk is that debt creating?
When Is Debt A Problem?
Generally speaking, debt only becomes a real problem when a company can't easily pay it off, either by raising capital or with its own cash flow. In the worst case scenario, a company can go bankrupt if it cannot pay its creditors. However, a more usual (but still expensive) situation is where a company must dilute shareholders at a cheap share price simply to get debt under control. Of course, debt can be an important tool in businesses, particularly capital heavy businesses. When we think about a company's use of debt, we first look at cash and debt together.
View our latest analysis for AAON
What Is AAON's Debt?
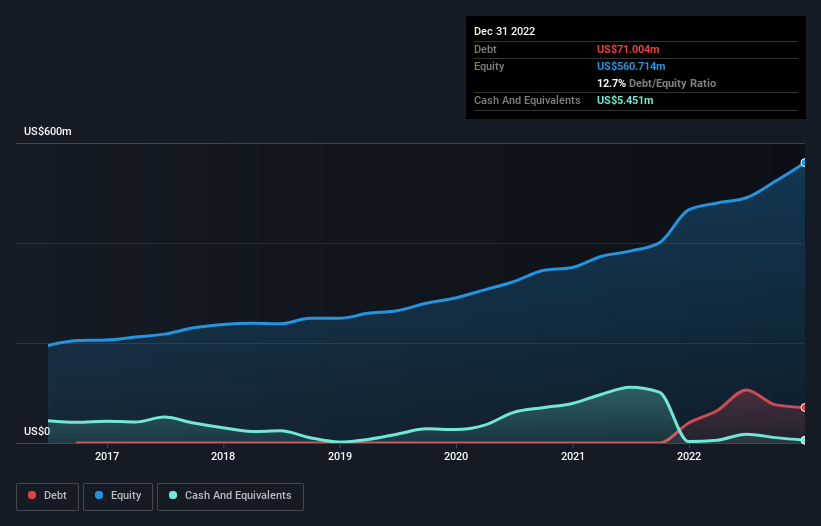
You can click the graphic below for the historical numbers, but it shows that as of December 2022 AAON had US$71.0m of debt, an increase on US$40.0m, over one year. On the flip side, it has US$5.45m in cash leading to net debt of about US$65.6m.
How Strong Is AAON's Balance Sheet?
Zooming in on the latest balance sheet data, we can see that AAON had liabilities of US$145.6m due within 12 months and liabilities of US$107.6m due beyond that. Offsetting this, it had US$5.45m in cash and US$142.3m in receivables that were due within 12 months. So it has liabilities totalling US$105.4m more than its cash and near-term receivables, combined.
Given AAON has a market capitalization of US$5.22b, it's hard to believe these liabilities pose much threat. However, we do think it is worth keeping an eye on its balance sheet strength, as it may change over time. But either way, AAON has virtually no net debt, so it's fair to say it does not have a heavy debt load!
We use two main ratios to inform us about debt levels relative to earnings. The first is net debt divided by earnings before interest, tax, depreciation, and amortization (EBITDA), while the second is how many times its earnings before interest and tax (EBIT) covers its interest expense (or its interest cover, for short). This way, we consider both the absolute quantum of the debt, as well as the interest rates paid on it.
AAON has a low net debt to EBITDA ratio of only 0.40. And its EBIT covers its interest expense a whopping 48.7 times over. So we're pretty relaxed about its super-conservative use of debt. In addition to that, we're happy to report that AAON has boosted its EBIT by 72%, thus reducing the spectre of future debt repayments. When analysing debt levels, the balance sheet is the obvious place to start. But ultimately the future profitability of the business will decide if AAON can strengthen its balance sheet over time. So if you're focused on the future you can check out this free report showing analyst profit forecasts.
But our final consideration is also important, because a company cannot pay debt with paper profits; it needs cold hard cash. So we always check how much of that EBIT is translated into free cash flow. Looking at the most recent three years, AAON recorded free cash flow of 25% of its EBIT, which is weaker than we'd expect. That's not great, when it comes to paying down debt.
Our View
The good news is that AAON's demonstrated ability to cover its interest expense with its EBIT delights us like a fluffy puppy does a toddler. But, on a more sombre note, we are a little concerned by its conversion of EBIT to free cash flow. Zooming out, AAON seems to use debt quite reasonably; and that gets the nod from us. After all, sensible leverage can boost returns on equity. Above most other metrics, we think its important to track how fast earnings per share is growing, if at all. If you've also come to that realization, you're in luck, because today you can view this interactive graph of AAON's earnings per share history for free.
If, after all that, you're more interested in a fast growing company with a rock-solid balance sheet, then check out our list of net cash growth stocks without delay.
If you're looking to trade AAON, open an account with the lowest-cost platform trusted by professionals, Interactive Brokers.
With clients in over 200 countries and territories, and access to 160 markets, IBKR lets you trade stocks, options, futures, forex, bonds and funds from a single integrated account.
Enjoy no hidden fees, no account minimums, and FX conversion rates as low as 0.03%, far better than what most brokers offer.
Sponsored ContentNew: Manage All Your Stock Portfolios in One Place
We've created the ultimate portfolio companion for stock investors, and it's free.
• Connect an unlimited number of Portfolios and see your total in one currency
• Be alerted to new Warning Signs or Risks via email or mobile
• Track the Fair Value of your stocks
Have feedback on this article? Concerned about the content? Get in touch with us directly. Alternatively, email editorial-team (at) simplywallst.com.
This article by Simply Wall St is general in nature. We provide commentary based on historical data and analyst forecasts only using an unbiased methodology and our articles are not intended to be financial advice. It does not constitute a recommendation to buy or sell any stock, and does not take account of your objectives, or your financial situation. We aim to bring you long-term focused analysis driven by fundamental data. Note that our analysis may not factor in the latest price-sensitive company announcements or qualitative material. Simply Wall St has no position in any stocks mentioned.
About NasdaqGS:AAON
AAON
Engages in engineering, manufacturing, marketing, and selling air conditioning and heating equipment in the United States and Canada.
Excellent balance sheet with reasonable growth potential.
Similar Companies
Market Insights

Community Narratives

