Advertisement
- United States
- /
- Banks
- /
- NYSE:FNB
Can FNB’s Recent Expansion Moves Justify Its Lower Price in 2025?

Simply Wall St
Reviewed by Bailey Pemberton
Thinking about what comes next for F.N.B stock? You are definitely not alone. Whether you have been watching from the sidelines or holding shares for years, the recent price moves may have you questioning if now is the right moment to make a move. In the last seven days, F.N.B is down 3.9%, and over the past month, it has slipped by 4.9%. That might seem concerning at first glance, especially if your focus is on the short term. However, when you zoom out, the picture looks far more optimistic. The stock is up 6.5% year to date and shows an 11.3% gain over the last 12 months. Anyone who has held on through the last five years has seen a remarkable 154.6% return, which certainly puts recent pullbacks in perspective.
Some of these price moves have coincided with a flurry of news about the company’s evolving strategy, including expansion into new regional markets and steps to streamline certain segments of its business. Investors are also tuning in to broader economic themes that could shape lending demand and credit conditions for banks like F.N.B. While these developments are meaningful for the bigger picture, seasoned observers know that a company’s valuation holds the real clues to long-term opportunity or risk.
By the numbers, F.N.B currently scores a 6 out of 6 in our key undervaluation checks. This suggests that every major valuation test points to its shares being undervalued right now.
Let’s dig into these valuation approaches and see what the data truly tells us. Be sure to read through to the end of the article, where we will outline an even more effective way to evaluate if F.N.B is a buy today.
Why F.N.B is lagging behind its peers
Approach 1: F.N.B Excess Returns Analysis
The Excess Returns valuation focuses on how much value a company can generate above the basic cost of equity for its shareholders. This model evaluates whether F.N.B is able to turn its investors' capital into actual shareholder value over time, using measures like book value, average return on equity, and projected earnings per share.
For F.N.B, the current Book Value stands at $18.52 per share, while the company’s average Return on Equity is 8.78%. Looking ahead, analysts estimate a stable EPS of $1.76 per share, with a cost of equity at $1.45 per share. This results in an excess return of $0.31 per share. Projections for stable book value push that figure up to $20.08 per share, supported by multiple analyst estimates.
According to the model, these fundamentals produce an estimated intrinsic value of $27.48 per share. Compared to the current market price, this calculation means F.N.B stock is currently trading at a 43.6% discount versus its intrinsic value, indicating the shares are undervalued based on excess returns.
Result: UNDERVALUED
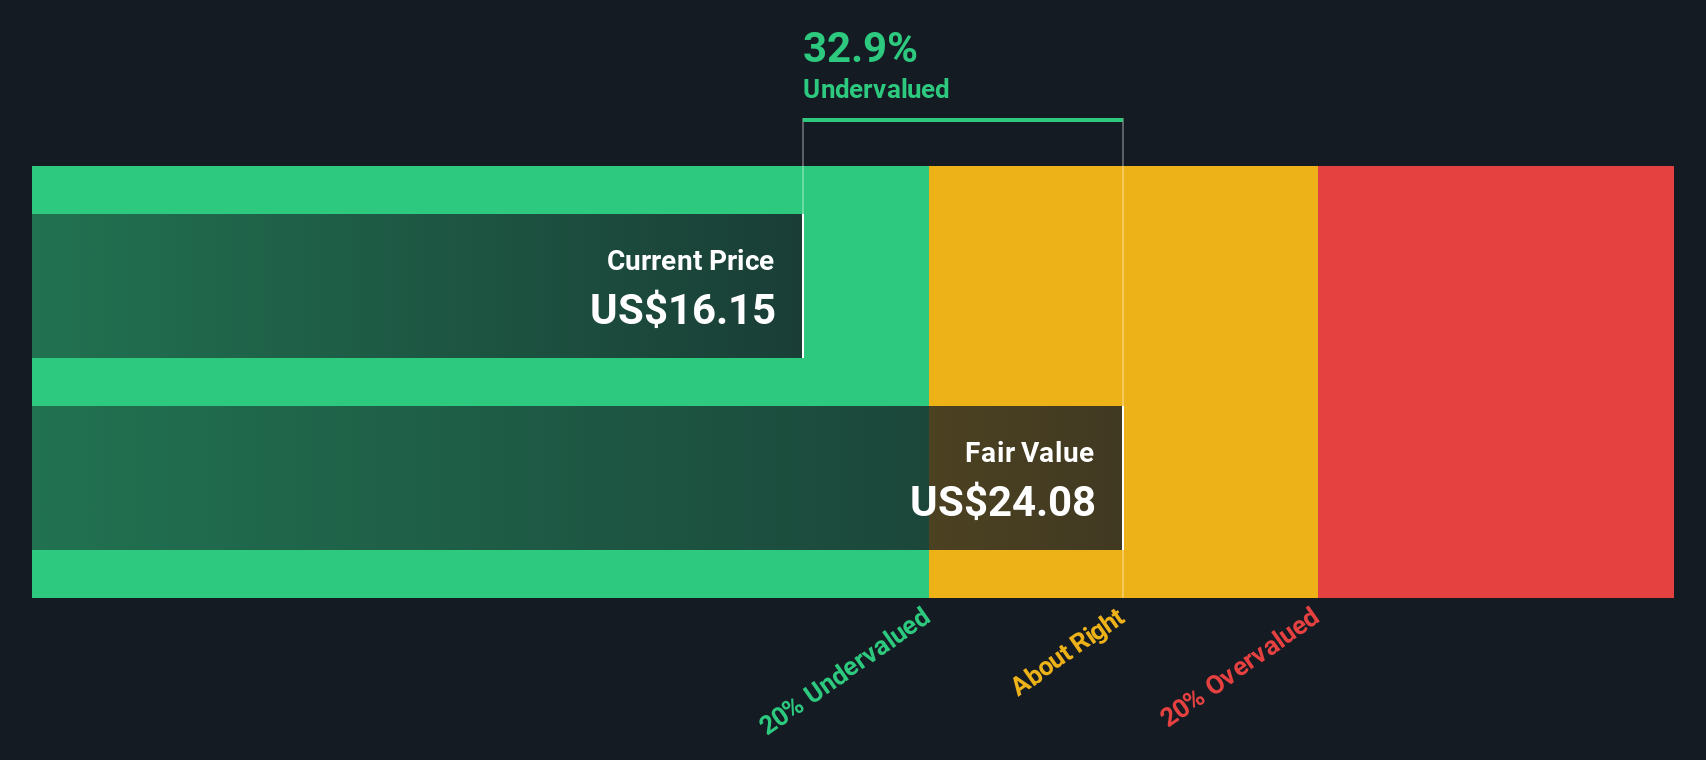
Our Excess Returns analysis suggests F.N.B is undervalued by 43.6%. Track this in your watchlist or portfolio, or discover more undervalued stocks.
Approach 2: F.N.B Price vs Earnings
The Price-to-Earnings (PE) ratio is a widely used valuation metric for profitable companies, as it helps investors assess how much they are paying for each dollar of earnings. For a business like F.N.B that consistently generates profits, the PE ratio offers a quick pulse check on whether the market views current earnings as justified, or expects higher growth or greater risks ahead.
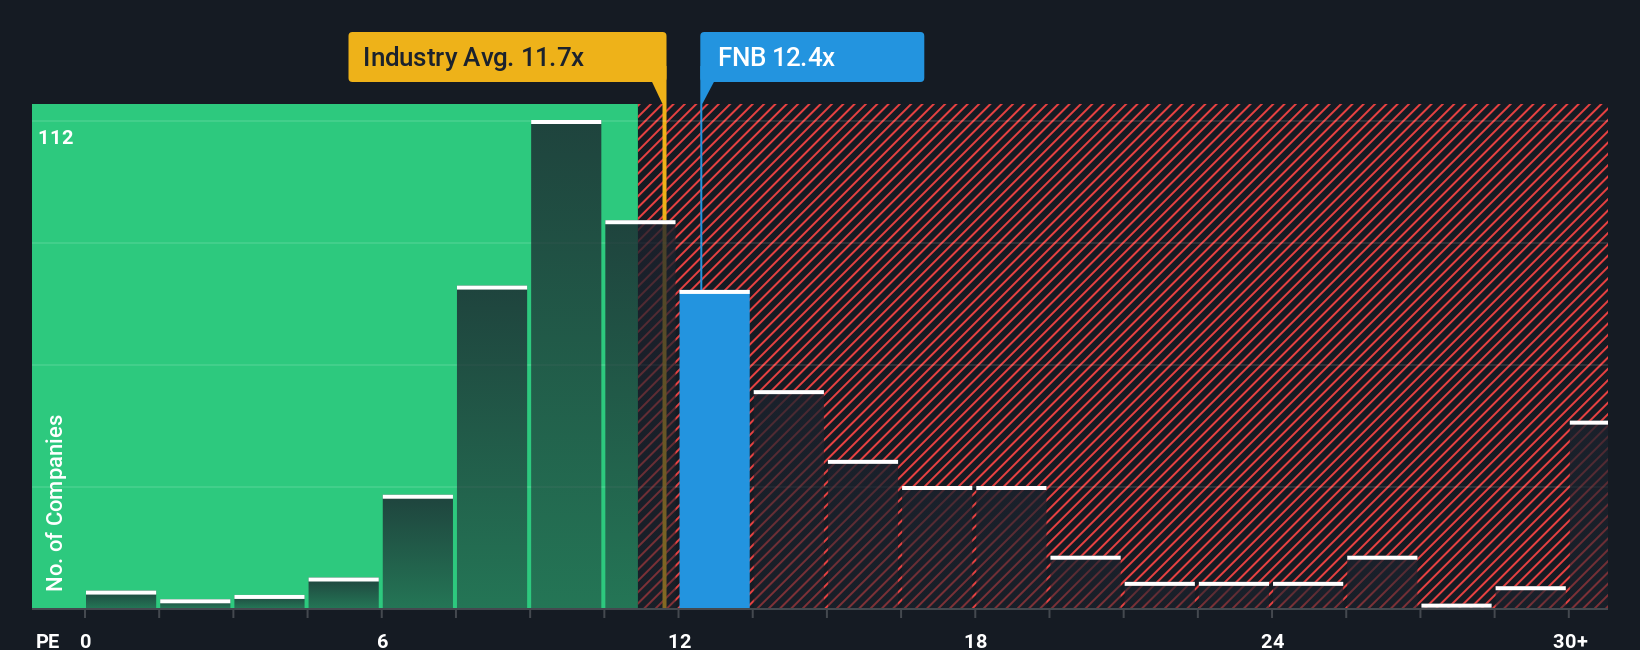
It is important to remember that a "normal" or "fair" PE ratio is shaped by expectations of future growth and how dependable those earnings are. A higher growth outlook or lower perceived risk will typically command a higher PE, while riskier banks or those expected to grow more slowly will see a lower multiple. F.N.B is currently trading at a PE ratio of 11x. That is slightly below the industry average of 11.2x and well under its listed peer average of 12.2x. This suggests the market is discounting F.N.B's near-term outlook compared with its banking peers.
Simply Wall St’s proprietary “Fair Ratio,” tailored for F.N.B, points to a fair PE of 13.9x. This estimate factors in not only industry trends and peer metrics, but also company-specific data like growth rate, profit margins, risk profile and market capitalization. Unlike simple averages, the Fair Ratio provides a more balanced and insightful valuation benchmark because it recognizes the unique qualities of F.N.B's business. With shares trading at 11x, notably lower than the Fair Ratio, F.N.B appears undervalued according to this measure.
Result: UNDERVALUED
PE ratios tell one story, but what if the real opportunity lies elsewhere? Discover companies where insiders are betting big on explosive growth.
Upgrade Your Decision Making: Choose your F.N.B Narrative
Earlier we mentioned there is an even better way to understand valuation, so let’s introduce you to Narratives. A Narrative is simply your story and perspective about a company, putting the numbers into real-world context with your own view on its fair value, future revenue, earnings, and margins. Narratives connect what is happening in F.N.B’s business and industry to a financial forecast, and then to an explicit fair value, making investment decisions feel logical and actionable rather than guesswork.
This tool is easy to use and available to everyone on Simply Wall St’s Community page, where millions of investors build their own Narratives and update them with every relevant news or earnings change. By directly comparing your Narrative’s fair value to the current share price, you can decide if F.N.B is a buy, sell, or hold with confidence and transparency.
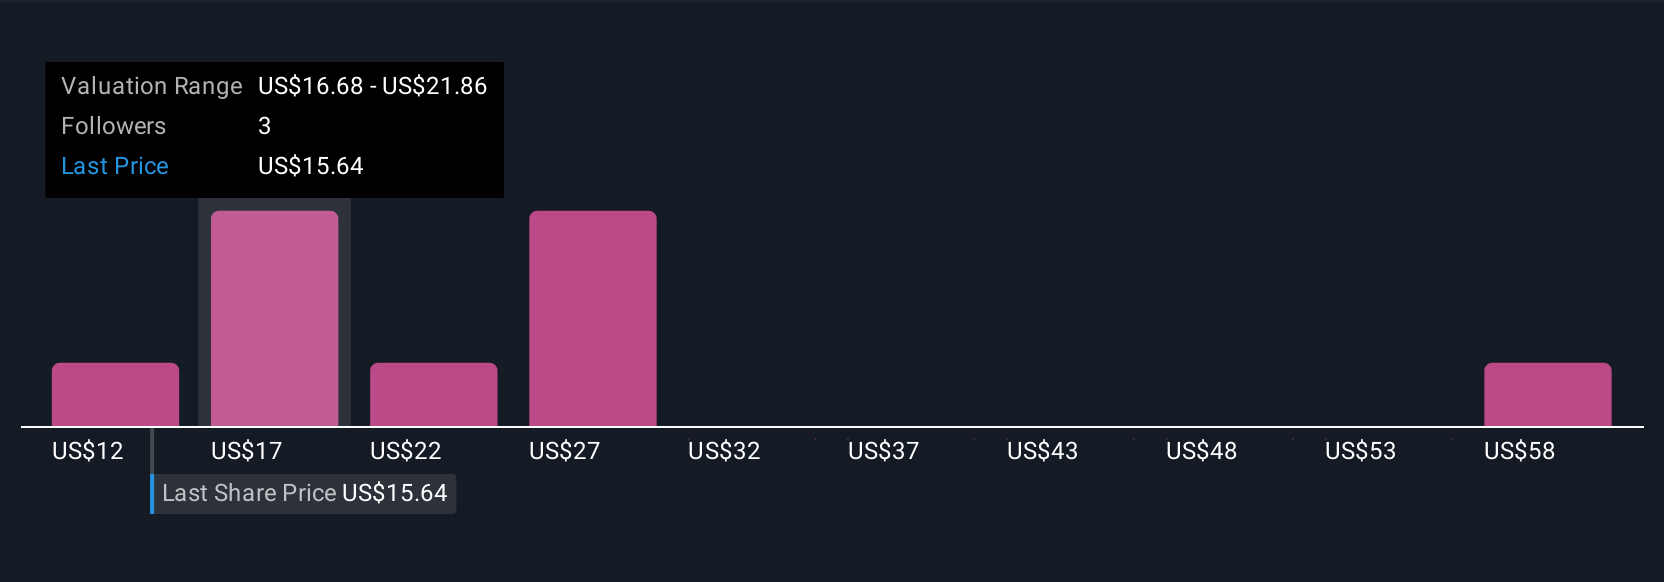
For example, one investor may believe F.N.B’s expanding digital strategy and regional growth will drive revenue and earnings higher, supporting a fair value as high as $18.56 per share. Another investor could be more cautious due to risks in regional banking and set their fair value closer to $16.36. Narratives put your investment thesis front and center, evolving with new facts and helping you personalize your decision making.
Do you think there's more to the story for F.N.B? Create your own Narrative to let the Community know!
This article by Simply Wall St is general in nature. We provide commentary based on historical data and analyst forecasts only using an unbiased methodology and our articles are not intended to be financial advice. It does not constitute a recommendation to buy or sell any stock, and does not take account of your objectives, or your financial situation. We aim to bring you long-term focused analysis driven by fundamental data. Note that our analysis may not factor in the latest price-sensitive company announcements or qualitative material. Simply Wall St has no position in any stocks mentioned.
New: AI Stock Screener & Alerts
Our new AI Stock Screener scans the market every day to uncover opportunities.
• Dividend Powerhouses (3%+ Yield)
• Undervalued Small Caps with Insider Buying
• High growth Tech and AI Companies
Or build your own from over 50 metrics.
Have feedback on this article? Concerned about the content? Get in touch with us directly. Alternatively, email editorial-team@simplywallst.com
About NYSE:FNB
F.N.B
A bank and financial holding company, provides a range of financial products and services primarily to consumers, corporations, governments, and small- to medium-sized businesses in the United States.
Very undervalued with flawless balance sheet and pays a dividend.
Similar Companies
Market Insights

Advertisement
Community Narratives
Finding The True Value Of A Logistics Powerhouse
Fair Value US$95.21|7.5% undervalued
NV
Community Contributor
Paradigm Biopharmaceuticals Will Lead Osteoarthritis Treatment with Zilosul's FDA Success
Fair Value AU$5.50|91.8% undervalued
AM
Community Contributor
Barrick Mining (ABX:CA): A Gold Hedge against a U.S. Shutdown
Fair Value CA$60.00|26.4% undervalued
GM
Community Contributor