Advertisement
- United States
- /
- Banks
- /
- NYSE:FLG
Evaluating Flagstar After Recent 5% Stock Jump and Industry Credit Market Stability in 2025

Simply Wall St
Reviewed by Bailey Pemberton
Making decisions about Flagstar Financial stock can feel like reading tea leaves, but let's cut through the noise together. If you have been tracking the share price lately, you will know it's been an eventful ride. Over the past week, the stock bounced 5.1% higher, but that move comes after a tough 30 days, where it lost 6.7%. Year to date, though, Flagstar Financial is up an impressive 31.0%, even with a choppy performance over longer periods such as the last three and five years.
Behind these numbers, investors have been reacting to broader shifts in the financial sector. There's a renewed sense of optimism as credit markets show more stability, and the company has benefited from signals that regional banks might have less exposure to certain risks than many feared last year. That could help explain some of the recent upward momentum in the stock, even if the past few years have seen their share of volatility.
Of course, the million-dollar question is whether Flagstar Financial is undervalued at its current price. Looking at six core valuation checks, the company scores only 2 points, indicating it is undervalued on just a couple of metrics. But is that enough to tip the scales in its favor, or do the risks still outweigh the rewards?
Let’s take a closer look at the most common valuation approaches, and then I’ll share a perspective that might give you an even clearer view of whether Flagstar Financial deserves a spot in your portfolio.
Flagstar Financial scores just 2/6 on our valuation checks. See what other red flags we found in the full valuation breakdown.
Approach 1: Flagstar Financial Excess Returns Analysis
The Excess Returns model evaluates whether a company generates returns above its cost of equity, focusing on how well it reinvests capital to create shareholder value. For Flagstar Financial, this approach highlights the relationship between the firm’s earnings power and its book value per share.
Currently, Flagstar Financial’s Book Value stands at $18.28 per share, while projected Stable EPS is $0.59 per share. These estimates are grounded in consensus forecasts from 11 analysts who have weighed future Return on Equity. The average Return on Equity is just 3.17%, and the Cost of Equity is substantially higher at $1.52 per share.
As a result, the company is producing an excess return of -$0.93 per share. Even when using a slightly improved Stable Book Value estimate of $18.49 per share from 10 analysts, these metrics do not support the case for value creation. In simple terms, Flagstar is generating returns below what investors require. The model interprets this as a significant negative. The estimated intrinsic value implies the stock is 3733.0% overvalued compared to its current price.
Result: OVERVALUED
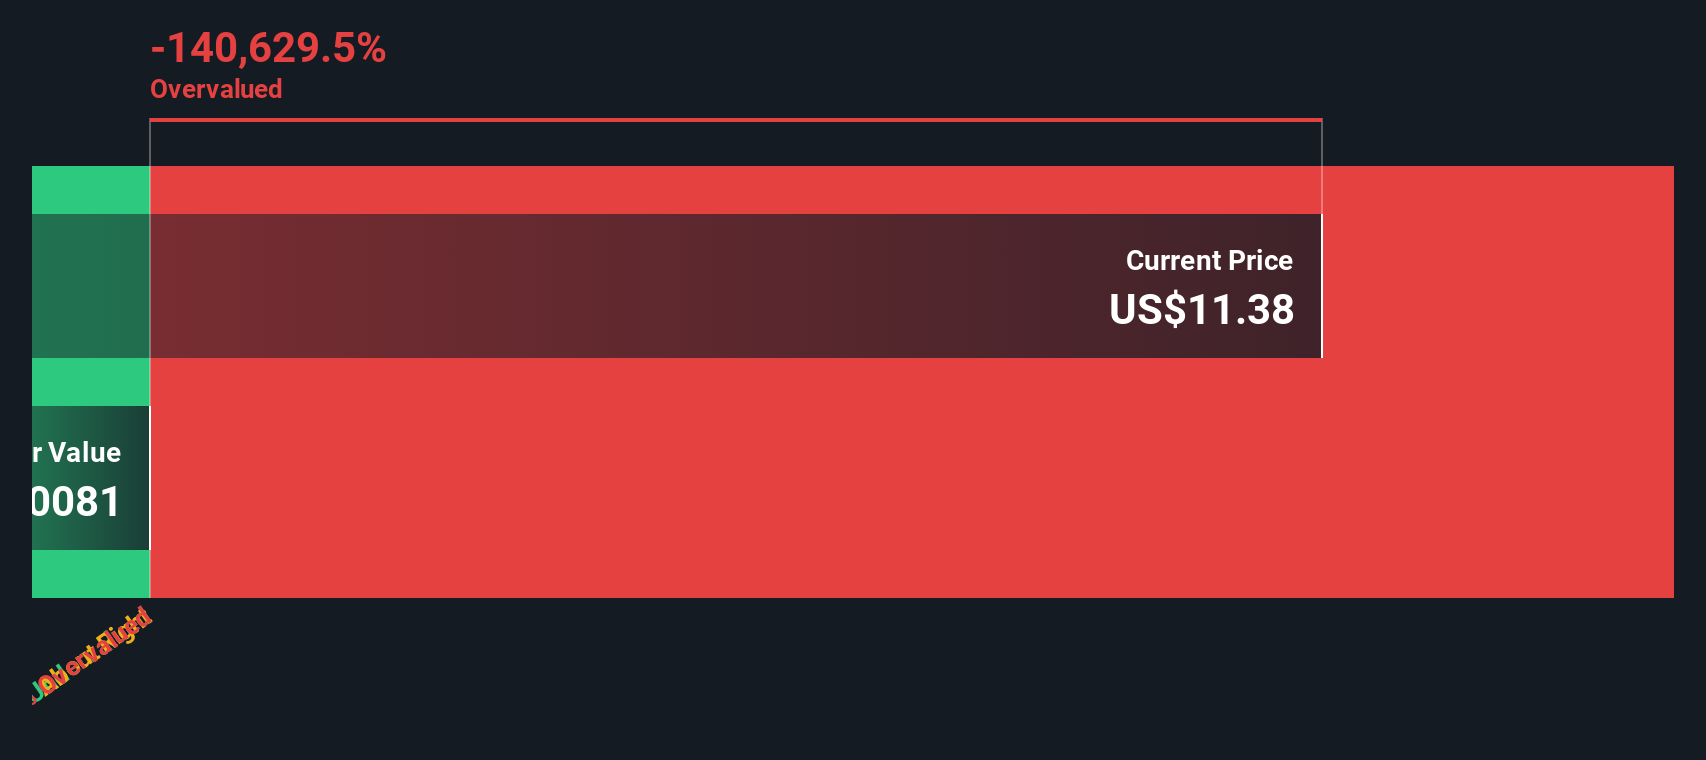
Our Excess Returns analysis suggests Flagstar Financial may be overvalued by 3733.0%. Find undervalued stocks or create your own screener to find better value opportunities.
Approach 2: Flagstar Financial Price vs Book
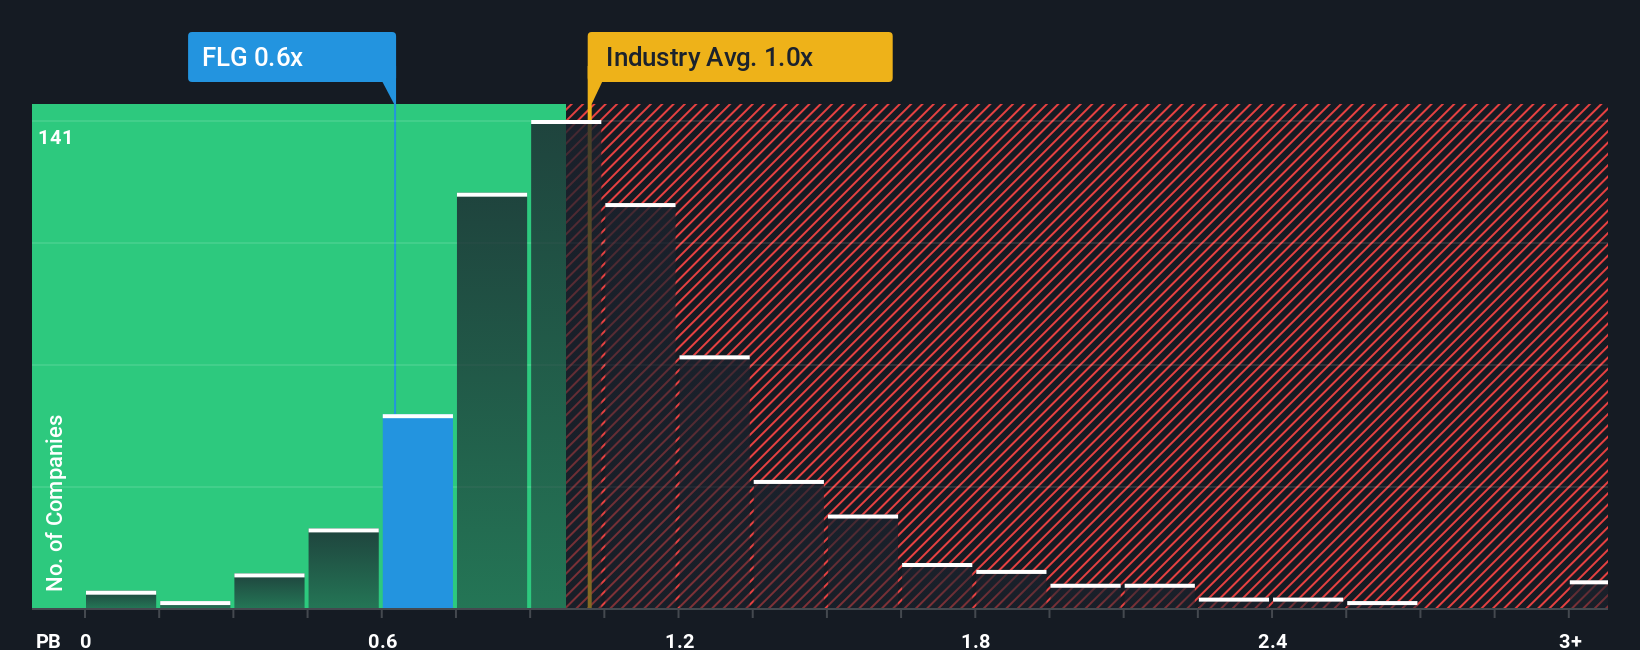
The price-to-book (P/B) ratio is an important valuation metric for banks and other financial institutions, as it allows investors to compare the market value of a company to its net asset value. Since profits in banking can be cyclical and influenced by different accounting standards, the P/B ratio helps reduce some of the noise and offers a clearer view of whether shares are trading at a premium or discount to the company’s tangible assets.
To interpret a “normal” or “fair” P/B ratio, analysts consider not just the current level of profitability but also expected future growth and the risks inherent in lending and balance sheets. Generally, higher-growth and lower-risk banks tend to command higher P/B ratios, while riskier, slower-growing institutions trade at lower multiples.
Flagstar Financial’s current P/B is 0.66x, which is well below both the industry average of 1.03x and its peers at 1.53x. This initially suggests the stock may be undervalued compared to what investors are willing to pay for other similar banks. However, Simply Wall St’s proprietary “Fair Ratio” takes the analysis further by factoring in Flagstar’s unique growth profile, risks, profit margins, industry, and market cap, providing a tailored benchmark beyond simple peer comparisons. This Fair Ratio gives a more comprehensive sense of what the stock should be worth on a relative basis.
Comparing Flagstar’s actual 0.66x multiple to its calculated Fair Ratio, there is a meaningful gap that suggests the market is undervaluing the stock based on its fundamentals. While industry and peer averages point to a discount, the Fair Ratio indicates that this discount may be larger than warranted.
Result: UNDERVALUED
PB ratios tell one story, but what if the real opportunity lies elsewhere? Discover companies where insiders are betting big on explosive growth.
Upgrade Your Decision Making: Choose your Flagstar Financial Narrative
Earlier we mentioned that there's an even better way to understand valuation. Let’s introduce you to Narratives. A Narrative is much more than just crunching numbers; it is your unique story about a company, connecting your assumptions about its future revenue, earnings, and margins to a fair value. Narratives give you the power to link what you believe will happen to Flagstar Financial with a concrete financial forecast, making your investment decisions more clear and meaningful.
Available right now on Simply Wall St’s Community page, Narratives are an easy and accessible tool already used by millions of investors to bring together qualitative insights and financial metrics. By building your own Narrative, you can see exactly when Fair Value exceeds or falls short of the current share Price, helping you decide when to buy or sell with more confidence. Plus, you will never be out of date as Narratives update automatically whenever new information like earnings or news is released.
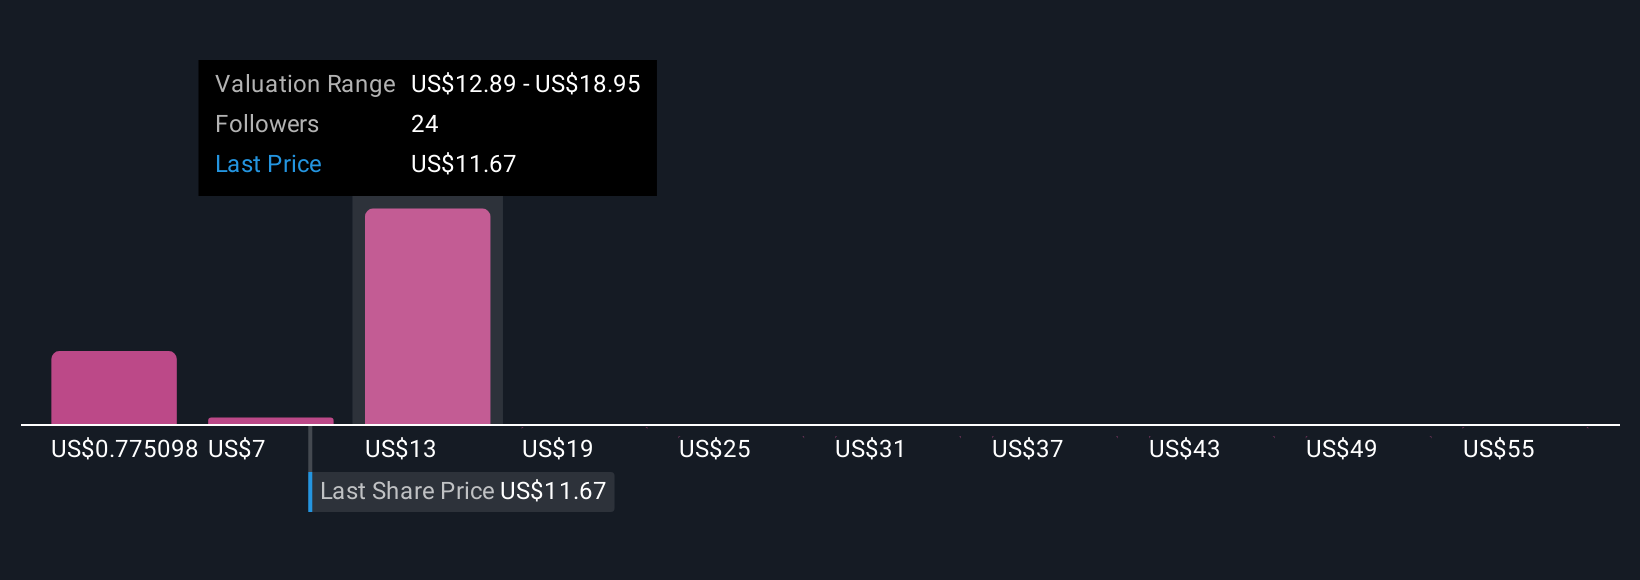
For example, some investors currently see Flagstar Financial’s fair value as much higher than the market price, while others set it much lower, showing just how personal and dynamic your investing story can be.
Do you think there's more to the story for Flagstar Financial? Create your own Narrative to let the Community know!
This article by Simply Wall St is general in nature. We provide commentary based on historical data and analyst forecasts only using an unbiased methodology and our articles are not intended to be financial advice. It does not constitute a recommendation to buy or sell any stock, and does not take account of your objectives, or your financial situation. We aim to bring you long-term focused analysis driven by fundamental data. Note that our analysis may not factor in the latest price-sensitive company announcements or qualitative material. Simply Wall St has no position in any stocks mentioned.
New: AI Stock Screener & Alerts
Our new AI Stock Screener scans the market every day to uncover opportunities.
• Dividend Powerhouses (3%+ Yield)
• Undervalued Small Caps with Insider Buying
• High growth Tech and AI Companies
Or build your own from over 50 metrics.
Have feedback on this article? Concerned about the content? Get in touch with us directly. Alternatively, email editorial-team@simplywallst.com
About NYSE:FLG
Flagstar Financial
Operates as the bank holding company for Flagstar Bank, N.A.
High growth potential with adequate balance sheet.
Similar Companies
Market Insights

Advertisement
Community Narratives
The Next Phase of Energy Storage: How NeoVolta Is Tackling America’s Power Crunch
Fair Value US$7.50|30.4% undervalued
MA
Community Contributor
A formidable player in AI and enterprise computing.
Fair Value US$210.00|3.0% undervalued
CO
Community Contributor
IREN's Bold Moves in Sustainable Bitcoin Mining & AI Data Centers
Fair Value US$72.52|20.4% undervalued
BL
Community Contributor
Cooling the Champions: The Aussie Tech Behind F1's Victories
Fair Value AU$12.40|38.1% undervalued
TR
Community Contributor