Advertisement
- United States
- /
- Banks
- /
- NasdaqGS:FULT
Does Fulton Financial’s Recent Slip Offer an Opportunity After Latest Dividend Announcement?

Simply Wall St
Reviewed by Bailey Pemberton
If you are staring at Fulton Financial’s ticker and wondering what comes next, you are not alone. The stock has quietly caught the eye of both cautious and optimistic investors after years of solid, if occasionally bumpy, performance. While volatility has crept in recently, with the price slipping -2.9% in the past week and -5.3% over the last month, the longer-term story is hard to ignore. Shares are up 10% over the past year, and an impressive 118.3% over five years, which suggests that underlying confidence in the company has held strong through broader market swings.
In recent months, regional bank stocks like Fulton Financial have bounced around as investors weigh the impact of interest rate movements and shifting economic sentiment. Some of the negative momentum this quarter can be linked to these sector-wide trends, as market participants reassess risk and reward in financials. Even so, Fulton’s year-to-date performance is down just -3.9%, despite the volatility. This underscores its resilience relative to peers.
Now for the key question: how does it stack up on valuation measures? Interestingly, Fulton Financial scores a robust 5 out of 6 on our valuation checklist, meaning it is currently considered undervalued by most of the major yardsticks. That should pique the interest of anyone looking for value in today’s market. Next, we will walk through the main valuation approaches, highlighting exactly where Fulton stands out, and hint at a more nuanced perspective that could give you the real edge as an investor.
Why Fulton Financial is lagging behind its peers
Approach 1: Fulton Financial Excess Returns Analysis
The Excess Returns valuation model analyzes how much profit a company can generate above its cost of equity, focusing on the returns made on reinvested capital. This approach highlights how efficiently Fulton Financial is putting its capital to work and whether it is truly creating value for shareholders after accounting for risks and required returns.
For Fulton Financial, the numbers tell an encouraging story. The company has a book value of $17.20 per share, and analysts estimate stable earnings per share (EPS) at $2.13. With a cost of equity of $1.53 per share, this implies an excess return of $0.59 per share. This means every dollar reinvested is generating meaningful value beyond what investors would require. Notably, the average return on equity stands at a solid 11.37%, and the stable book value is projected to gradually rise to $18.71 per share, based on a consensus from five analysts.
Applying the Excess Returns Model, the estimated intrinsic value for Fulton Financial is $30.26 per share. Compared to the current share price, this implies the stock is 39.4% undervalued, which is a significant margin of safety for value-focused investors.
Result: UNDERVALUED
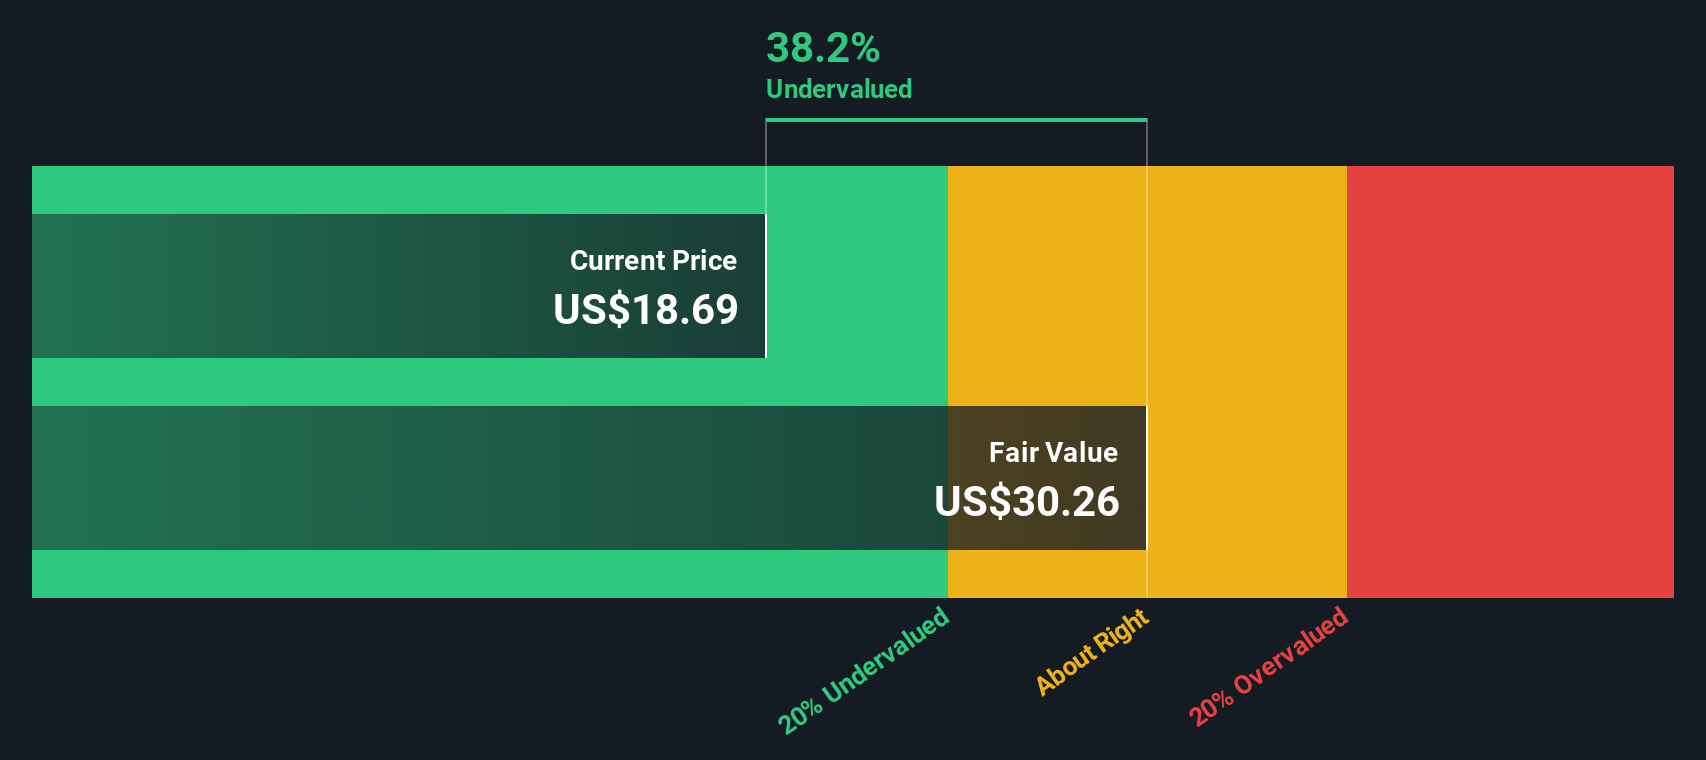
Our Excess Returns analysis suggests Fulton Financial is undervalued by 39.4%. Track this in your watchlist or portfolio, or discover more undervalued stocks.
Approach 2: Fulton Financial Price vs Earnings
For profitable companies like Fulton Financial, the Price-to-Earnings (PE) ratio is one of the most widely used valuation metrics. It offers a quick snapshot of how much investors are willing to pay for every dollar of earnings, making it especially useful for established, consistently profitable banks.
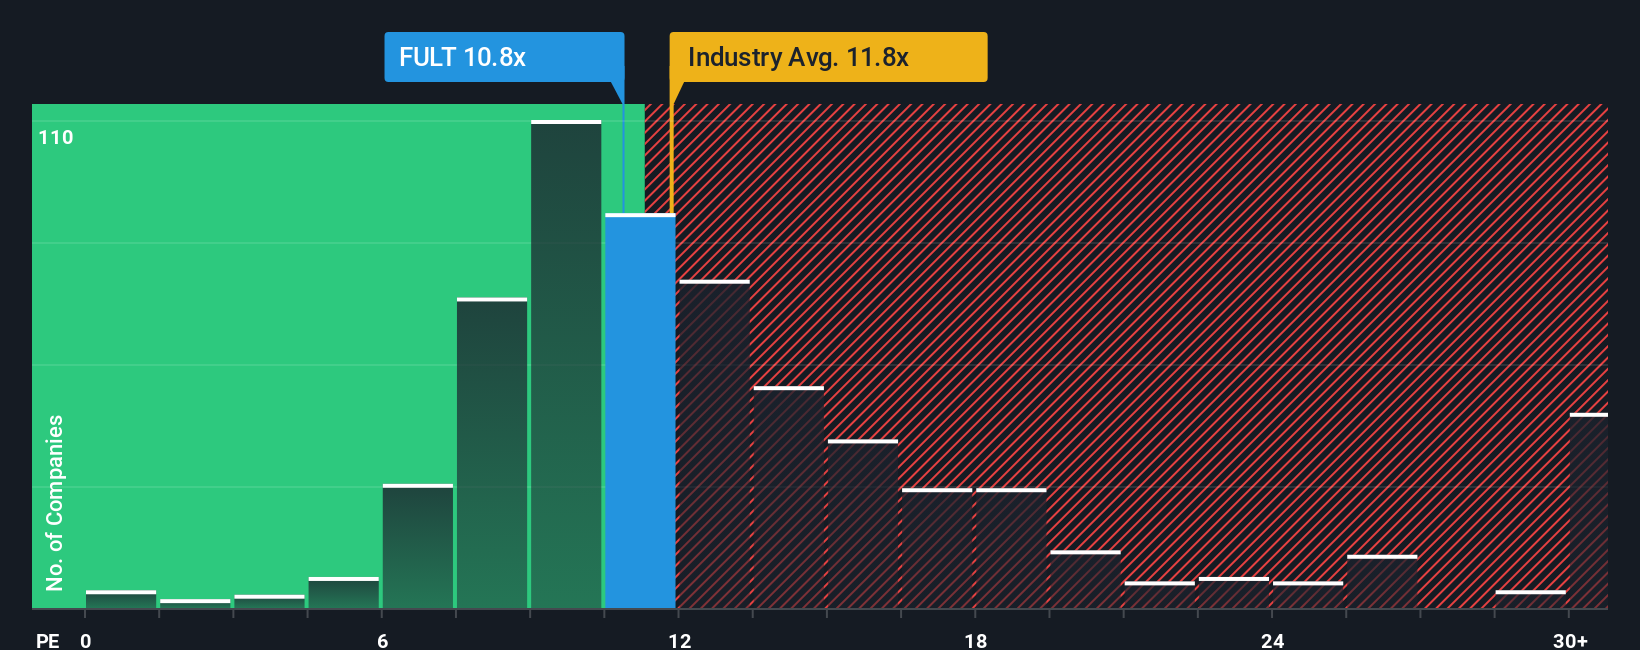
The “right” PE ratio for a stock depends on a few moving parts. Companies with higher expected growth often command higher PEs, while increased risk or slower growth pulls them down. Market peers and industries set general benchmarks, but every company’s story is a bit different. Fulton Financial is currently trading at a PE ratio of 10.7x. This is below the industry average of 11.8x and well beneath the peer average of 16x, hinting at a potential discount in the market’s expectations.
Simply Wall St’s “Fair Ratio” for Fulton Financial is 13.0x, a metric that goes beyond basic peer or industry comparisons. Unlike a simple average, the Fair Ratio incorporates Fulton’s unique mix of earnings growth, profit margins, industry trends, company size, and risk profile. This tailored benchmark means investors get an assessment more closely linked to Fulton’s actual prospects rather than just where the crowd sits.
With Fulton’s current PE ratio sitting about 2.3 points below its Fair Ratio, this signals the stock is undervalued on earnings. In plain terms, the market is underestimating what Fulton is capable of delivering compared to what’s normal for its profile.
Result: UNDERVALUED
PE ratios tell one story, but what if the real opportunity lies elsewhere? Discover companies where insiders are betting big on explosive growth.
Upgrade Your Decision Making: Choose your Fulton Financial Narrative
Earlier we mentioned that there is an even better way to understand valuation. Let’s introduce you to Narratives. A Narrative is a simple yet powerful tool that lets you connect your story or perspective on a company, such as your assumptions for its future revenue, earnings, and margins, directly to a financial forecast and estimated fair value. Narratives bring the numbers to life, letting you and millions of other investors on Simply Wall St’s Community page see not just what a company is worth, but why. By crafting or reviewing a Narrative, you are able to compare your fair value to the current share price, making buy or sell decisions much more informed and personalized.
Unlike static models, Narratives are updated in real time as new news, results, or events emerge. This ensures your view stays relevant. For example, one investor might see Fulton Financial as poised for strong growth and assign a fair value well above $20.8 per share. Another investor might take a more cautious view and estimate a fair value closer to the current market price. Narratives help you weigh these perspectives side by side, so you can invest with confidence, clarity, and your own rationale driving the decision.
Do you think there's more to the story for Fulton Financial? Create your own Narrative to let the Community know!
This article by Simply Wall St is general in nature. We provide commentary based on historical data and analyst forecasts only using an unbiased methodology and our articles are not intended to be financial advice. It does not constitute a recommendation to buy or sell any stock, and does not take account of your objectives, or your financial situation. We aim to bring you long-term focused analysis driven by fundamental data. Note that our analysis may not factor in the latest price-sensitive company announcements or qualitative material. Simply Wall St has no position in any stocks mentioned.
New: AI Stock Screener & Alerts
Our new AI Stock Screener scans the market every day to uncover opportunities.
• Dividend Powerhouses (3%+ Yield)
• Undervalued Small Caps with Insider Buying
• High growth Tech and AI Companies
Or build your own from over 50 metrics.
Have feedback on this article? Concerned about the content? Get in touch with us directly. Alternatively, email editorial-team@simplywallst.com
About NasdaqGS:FULT
Fulton Financial
Operates as the bank holding company for Fulton Bank that provides banking and financial products and services in the United States.
Flawless balance sheet, undervalued and pays a dividend.
Similar Companies
Market Insights

Advertisement
Community Narratives
The Next Phase of Energy Storage: How NeoVolta Is Tackling America’s Power Crunch
Fair Value US$7.50|35.1% undervalued
MA
Community Contributor
Why EnSilica is Worth Possibly 13x its Current Price
Fair Value UK£5.00|89.8% undervalued
DO
Community Contributor
M&A Activity, Industry Diversification & A Defense Contract Monopoly Will Push BWXT For Healthy Long-Term Growth
Fair Value US$220.00|15.2% undervalued
CL
Community Contributor
A case for Cassiar Gold Corp (TSXV: GLDC) to reach CAD$8-10 before 2030 (X30-37)
Fair Value CA$10.00|96.0% undervalued
AG
Community Contributor