Advertisement
- United States
- /
- Auto
- /
- NYSE:THO
Thor Industries (THO): Thin 2.7% Margin Tests Bullish High-Growth, DCF-Upside Narrative

Simply Wall St
Reviewed by Simply Wall St
Thor Industries (THO) opened Q1 2026 earnings season with Q4 2025 revenue of about $2.5 billion and EPS of $2.37, setting the tone for how investors will judge the latest update against a choppy recent history. The company has seen quarterly revenue move from roughly $2.5 billion in Q4 2024 to $2.9 billion in Q3 2025 before landing back near $2.5 billion in Q4 2025, while EPS has swung from $1.70 to $2.54 over the same stretch. This underscores how tight margins remain central to the story.
See our full analysis for THOR Industries.With the headline numbers on the table, the next step is to see how they line up against the most common narratives about Thor Industries, from its earnings power to how sustainable its margins really are.
Curious how numbers become stories that shape markets? Explore Community Narratives
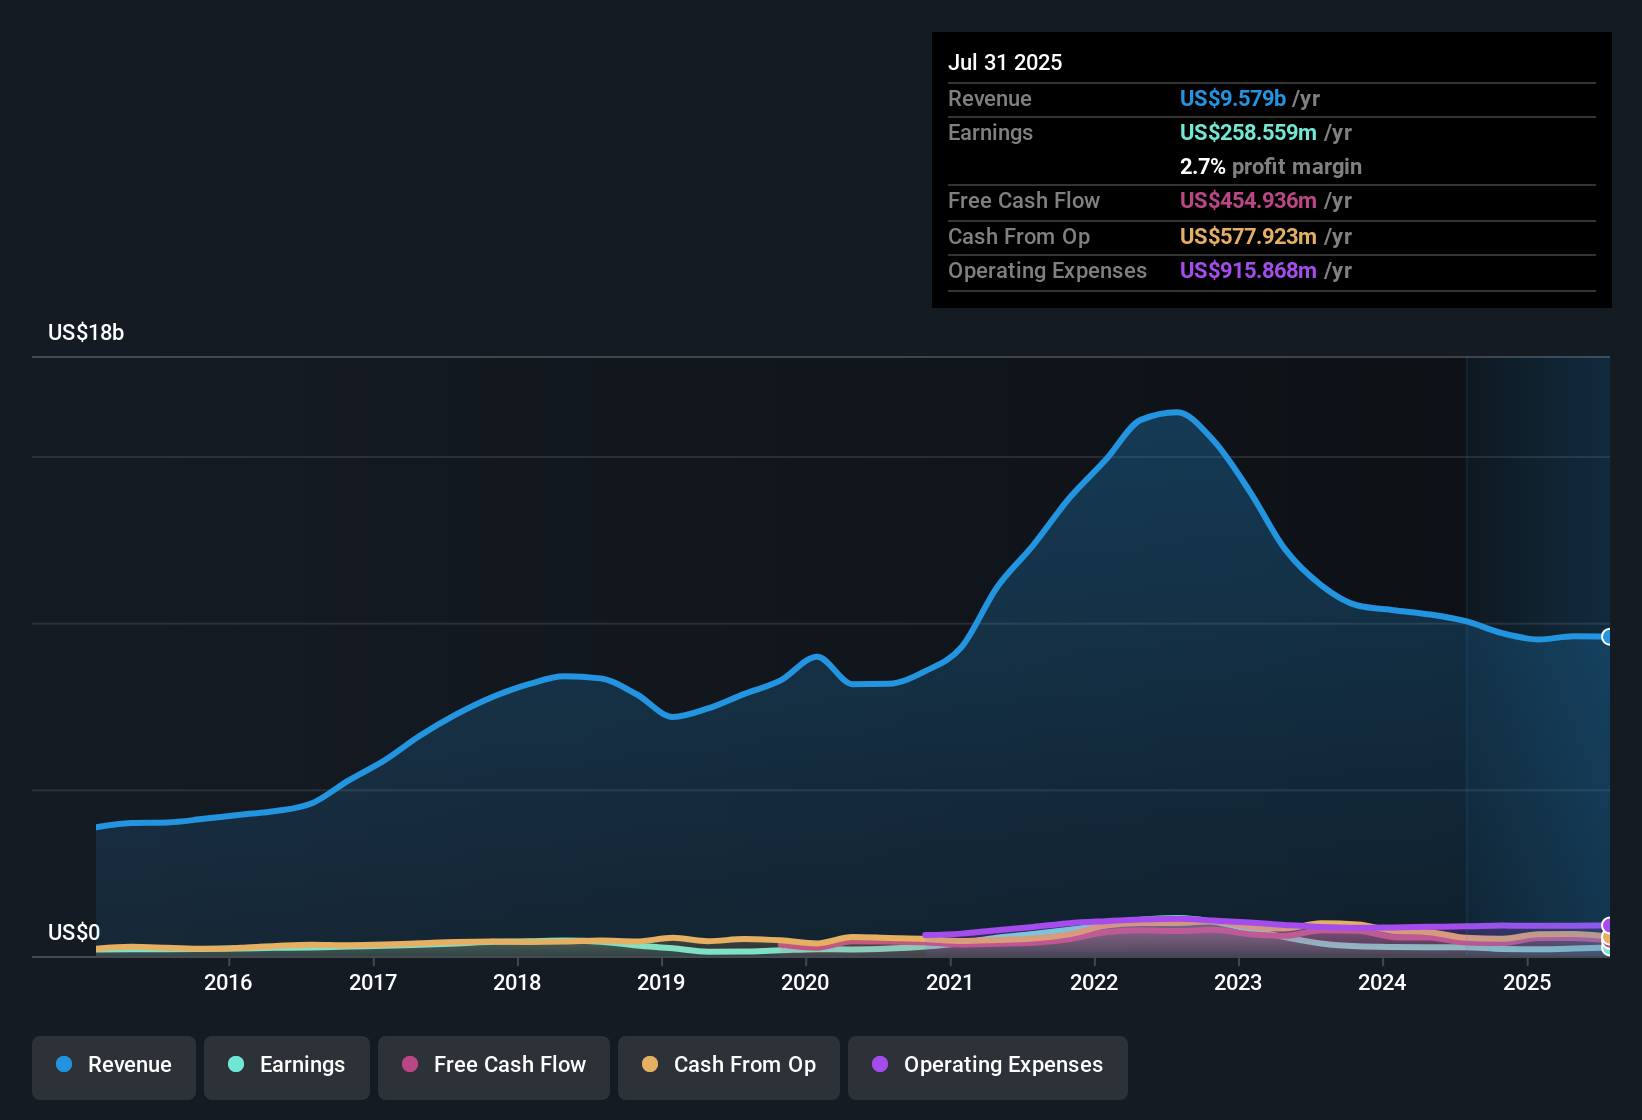
Margins Stay Thin At 2.7 Percent
- Over the last year, THOR converted $9.6 billion of revenue into $258.6 million of net income, which works out to a 2.7 percent net margin, only slightly above the prior year’s 2.6 percent.
- What stands out for the bullish view is that this modest 2.7 percent margin sits alongside forecasts for roughly 25.7 percent annual earnings growth.
- Supporters can point to the shift from small losses in early 2025 to $125.8 million of net income in Q4 2025 as evidence the business can turn scale into profit even in a tough patch.
- At the same time, the five year earnings decline of 21.8 percent per year reminds you that sustaining this margin and the projected growth is not a done deal yet.
Five Year Earnings Slide Versus 25.7 Percent Growth Outlook
- Over the past five years, earnings have fallen about 21.8 percent per year, yet the same dataset now shows expected earnings growth of around 25.7 percent a year going forward, creating a sharp contrast between history and outlook.
- Bears focus on that long term decline as a warning sign.
- They can point to the trailing one year earnings drop on top of that five year slide to argue that the turnaround case still has to be proven in more than a couple of strong quarters.
- However, the improvement from negative EPS in Q1 and Q2 2025 to positive EPS above 2 dollars in Q3 and Q4 2025 shows that recent operational momentum does not fully match the backward looking narrative of steady deterioration.
DCF Fair Value Towering Over 99.76 Dollar Share Price
- The stock trades at 99.76 dollars, which is about 42.5 percent below a stated DCF fair value of 173.39 dollars, while the P E ratio of 20.4 times sits above the Global Auto average of 18.3 times but below the peer average of 23.4 times.
- Bulls argue that the combination of this valuation gap and a 2.09 percent dividend yield offers attractive upside.
- On their side, the 8.4 percent forecast revenue growth and high expected profit growth above 20 percent per year give some numerical backing to the idea that current multiples could compress as earnings catch up.
- On the other hand, the fact that a 20.4 times P E is still richer than the broader industry despite the five year earnings decline means the market is already paying something for that recovery story and not treating THOR as a deep value name.
Next Steps
Don't just look at this quarter; the real story is in the long-term trend. We've done an in-depth analysis on THOR Industries's growth and its valuation to see if today's price is a bargain. Add the company to your watchlist or portfolio now so you don't miss the next big move.
See What Else Is Out There
Thor Industries faces thin margins, a multiyear earnings decline, and a valuation that already bakes in a demanding recovery story despite recent quarterly improvements.
If those swings make you uneasy, use our CTA_SCREENER_STABLE_GROWTH to quickly shift your focus toward companies with steadier earnings trajectories and more predictable long term compounding potential.
This article by Simply Wall St is general in nature. We provide commentary based on historical data and analyst forecasts only using an unbiased methodology and our articles are not intended to be financial advice. It does not constitute a recommendation to buy or sell any stock, and does not take account of your objectives, or your financial situation. We aim to bring you long-term focused analysis driven by fundamental data. Note that our analysis may not factor in the latest price-sensitive company announcements or qualitative material. Simply Wall St has no position in any stocks mentioned.
Valuation is complex, but we're here to simplify it.
Discover if THOR Industries might be undervalued or overvalued with our detailed analysis, featuring fair value estimates, potential risks, dividends, insider trades, and its financial condition.
Access Free AnalysisHave feedback on this article? Concerned about the content? Get in touch with us directly. Alternatively, email editorial-team@simplywallst.com
About NYSE:THO
THOR Industries
Designs, manufactures, and sells recreational vehicles (RVs), and related parts and accessories in the United States, Germany, rest of Europe, Canada, and internationally.
Flawless balance sheet established dividend payer.
Similar Companies
Market Insights

Advertisement
Weekly Picks
RO


RockeTeller on Santacruz Silver Mining ·
Crazy Undervalued 42 Baggers Silver Play (Active & Running Mine)
Fair Value:CA$8696.4% undervalued
40 followersusers have followed this narrative
6 commentsusers have commented on this narrative
11 likesusers have liked this narrative
RO


Robbo on Fiducian Group ·
Fiducian: Compliance Clouds or Value Opportunity?
Fair Value:AU$123.8% undervalued
4 followersusers have followed this narrative
0 commentsusers have commented on this narrative
0 likesusers have liked this narrative
WO

woodworthfund on Willamette Valley Vineyards ·
Willamette Valley Vineyards (WVVI): Not-So-Great Value
Fair Value:US$244.5% overvalued
6 followersusers have followed this narrative
0 commentsusers have commented on this narrative
1 likeusers have liked this narrative
Recently Updated Narratives
FU

FundamentallySarcastic on Credit Corp Group ·
Moderation and Stabilisation: HOLD: Fair Price based on a 4-year Cycle is $12.08
Fair Value:AU$12.6411.8% overvalued
3 followersusers have followed this narrative
0 commentsusers have commented on this narrative
0 likesusers have liked this narrative
MA


MarkoVT on Alphabet ·
Positioned globally, partnered locally
Fair Value:US$390.1918.1% undervalued
6 followersusers have followed this narrative
0 commentsusers have commented on this narrative
0 likesusers have liked this narrative
JO


JohnJ on Worldline ·
When will fraudsters be investigated in depth. Fraud was ongoing in France too.
Fair Value:€0.5190.0% overvalued
3 followersusers have followed this narrative
0 commentsusers have commented on this narrative
0 likesusers have liked this narrative
Popular Narratives
TH


TheWallstreetKing on MicroVision ·
MicroVision will explode future revenue by 380.37% with a vision towards success
Fair Value:US$6098.5% undervalued
115 followersusers have followed this narrative
11 commentsusers have commented on this narrative
22 likesusers have liked this narrative
AN


AnalystConsensusTarget on NVIDIA ·
NVDA: Expanding AI Demand Will Drive Major Data Center Investments Through 2026
Fair Value:US$250.3928.3% undervalued
953 followersusers have followed this narrative
6 commentsusers have commented on this narrative
25 likesusers have liked this narrative
OS

oscargarcia on Alphabet ·
The company that turned a verb into a global necessity and basically runs the modern internet, digital ads, smartphones, maps, and AI.
Fair Value:US$3406.0% undervalued
147 followersusers have followed this narrative
6 commentsusers have commented on this narrative
18 likesusers have liked this narrative

