
Advertisement
- Taiwan
- /
- Electronic Equipment and Components
- /
- TPEX:6642
Fuzetec Technology's (GTSM:6642) Earnings Are Growing But Is There More To The Story?
Broadly speaking, profitable businesses are less risky than unprofitable ones. That said, the current statutory profit is not always a good guide to a company's underlying profitability. This article will consider whether Fuzetec Technology's (GTSM:6642) statutory profits are a good guide to its underlying earnings.
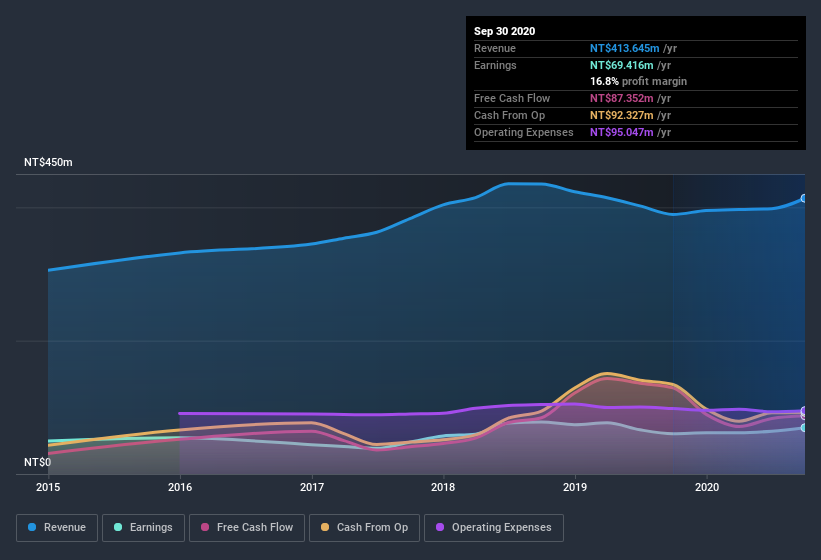
We like the fact that Fuzetec Technology made a profit of NT$69.4m on its revenue of NT$413.6m, in the last year. Happily, it has grown both its profit and revenue over the last three years, as you can see in the chart below.
View our latest analysis for Fuzetec Technology
Importantly, statutory profits are not always the best tool for understanding a company's true earnings power, so it's well worth examining profits in a little more detail. Today, we'll discuss Fuzetec Technology's free cashflow relative to its earnings, and consider what that tells us about the company. Note: we always recommend investors check balance sheet strength. Click here to be taken to our balance sheet analysis of Fuzetec Technology.
Zooming In On Fuzetec Technology's Earnings
In high finance, the key ratio used to measure how well a company converts reported profits into free cash flow (FCF) is the accrual ratio (from cashflow). In plain english, this ratio subtracts FCF from net profit, and divides that number by the company's average operating assets over that period. This ratio tells us how much of a company's profit is not backed by free cashflow.
As a result, a negative accrual ratio is a positive for the company, and a positive accrual ratio is a negative. While having an accrual ratio above zero is of little concern, we do think it's worth noting when a company has a relatively high accrual ratio. That's because some academic studies have suggested that high accruals ratios tend to lead to lower profit or less profit growth.
Over the twelve months to September 2020, Fuzetec Technology recorded an accrual ratio of -0.13. Therefore, its statutory earnings were quite a lot less than its free cashflow. Indeed, in the last twelve months it reported free cash flow of NT$87m, well over the NT$69.4m it reported in profit. Fuzetec Technology did see its free cash flow drop year on year, which is less than ideal, like a Simpson's episode without Groundskeeper Willie.
Our Take On Fuzetec Technology's Profit Performance
As we discussed above, Fuzetec Technology has perfectly satisfactory free cash flow relative to profit. Based on this observation, we consider it likely that Fuzetec Technology's statutory profit actually understates its earnings potential! And on top of that, its earnings per share have grown at 25% per year over the last three years. The goal of this article has been to assess how well we can rely on the statutory earnings to reflect the company's potential, but there is plenty more to consider. So if you'd like to dive deeper into this stock, it's crucial to consider any risks it's facing. You'd be interested to know, that we found 2 warning signs for Fuzetec Technology and you'll want to know about these.
This note has only looked at a single factor that sheds light on the nature of Fuzetec Technology's profit. But there are plenty of other ways to inform your opinion of a company. Some people consider a high return on equity to be a good sign of a quality business. While it might take a little research on your behalf, you may find this free collection of companies boasting high return on equity, or this list of stocks that insiders are buying to be useful.
If you’re looking to trade Fuzetec Technology, open an account with the lowest-cost* platform trusted by professionals, Interactive Brokers. Their clients from over 200 countries and territories trade stocks, options, futures, forex, bonds and funds worldwide from a single integrated account. Promoted
New: AI Stock Screener & Alerts
Our new AI Stock Screener scans the market every day to uncover opportunities.
• Dividend Powerhouses (3%+ Yield)
• Undervalued Small Caps with Insider Buying
• High growth Tech and AI Companies
Or build your own from over 50 metrics.
This article by Simply Wall St is general in nature. It does not constitute a recommendation to buy or sell any stock, and does not take account of your objectives, or your financial situation. We aim to bring you long-term focused analysis driven by fundamental data. Note that our analysis may not factor in the latest price-sensitive company announcements or qualitative material. Simply Wall St has no position in any stocks mentioned.
*Interactive Brokers Rated Lowest Cost Broker by StockBrokers.com Annual Online Review 2020
Have feedback on this article? Concerned about the content? Get in touch with us directly. Alternatively, email editorial-team@simplywallst.com.
About TPEX:6642
Fuzetec Technology
Engages in the manufacturing and trading of electronic components products in Mainland China, Taiwan, the United States, and internationally.
Excellent balance sheet with low risk.
Similar Companies
Market Insights

Advertisement
Weekly Picks
RO


RockeTeller on Santacruz Silver Mining ·
Crazy Undervalued 42 Baggers Silver Play (Active & Running Mine)
Fair Value:CA$8696.4% undervalued
38 followersusers have followed this narrative
6 commentsusers have commented on this narrative
10 likesusers have liked this narrative
RO


Robbo on Fiducian Group ·
Fiducian: Compliance Clouds or Value Opportunity?
Fair Value:AU$126.1% undervalued
4 followersusers have followed this narrative
0 commentsusers have commented on this narrative
0 likesusers have liked this narrative
WO

woodworthfund on Willamette Valley Vineyards ·
Willamette Valley Vineyards (WVVI): Not-So-Great Value
Fair Value:US$244.5% overvalued
6 followersusers have followed this narrative
0 commentsusers have commented on this narrative
1 likeusers have liked this narrative
Recently Updated Narratives
FU

FundamentallySarcastic on Credit Corp Group ·
Moderation and Stabilisation: HOLD: Fair Price based on a 4-year Cycle is $12.08
Fair Value:AU$12.6411.4% overvalued
1 followerusers have followed this narrative
0 commentsusers have commented on this narrative
0 likesusers have liked this narrative
MA


MarkoVT on Alphabet ·
Positioned globally, partnered locally
Fair Value:US$390.1918.1% undervalued
2 followersusers have followed this narrative
0 commentsusers have commented on this narrative
0 likesusers have liked this narrative
JO


JohnJ on Worldline ·
When will fraudsters be investigated in depth. Fraud was ongoing in France too.
Fair Value:€0.5190.0% overvalued
1 followerusers have followed this narrative
0 commentsusers have commented on this narrative
0 likesusers have liked this narrative
Popular Narratives
TH


TheWallstreetKing on MicroVision ·
MicroVision will explode future revenue by 380.37% with a vision towards success
Fair Value:US$6098.5% undervalued
114 followersusers have followed this narrative
11 commentsusers have commented on this narrative
22 likesusers have liked this narrative
AN


AnalystConsensusTarget on NVIDIA ·
NVDA: Expanding AI Demand Will Drive Major Data Center Investments Through 2026
Fair Value:US$250.3928.3% undervalued
952 followersusers have followed this narrative
6 commentsusers have commented on this narrative
25 likesusers have liked this narrative
OS

oscargarcia on Alphabet ·
The company that turned a verb into a global necessity and basically runs the modern internet, digital ads, smartphones, maps, and AI.
Fair Value:US$3406.0% undervalued
148 followersusers have followed this narrative
6 commentsusers have commented on this narrative
18 likesusers have liked this narrative

