Howard Marks put it nicely when he said that, rather than worrying about share price volatility, 'The possibility of permanent loss is the risk I worry about... and every practical investor I know worries about.' So it might be obvious that you need to consider debt, when you think about how risky any given stock is, because too much debt can sink a company. We note that TUL Corporation (GTSM:6150) does have debt on its balance sheet. But the more important question is: how much risk is that debt creating?
When Is Debt Dangerous?
Debt assists a business until the business has trouble paying it off, either with new capital or with free cash flow. If things get really bad, the lenders can take control of the business. While that is not too common, we often do see indebted companies permanently diluting shareholders because lenders force them to raise capital at a distressed price. Of course, plenty of companies use debt to fund growth, without any negative consequences. When we examine debt levels, we first consider both cash and debt levels, together.
View our latest analysis for TUL
How Much Debt Does TUL Carry?
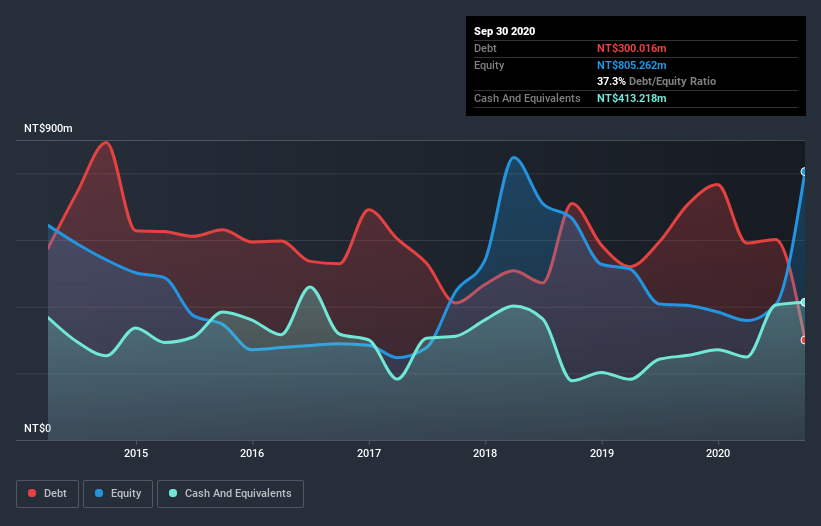
As you can see below, TUL had NT$300.0m of debt at September 2020, down from NT$708.6m a year prior. But on the other hand it also has NT$413.2m in cash, leading to a NT$113.2m net cash position.

How Strong Is TUL's Balance Sheet?
According to the last reported balance sheet, TUL had liabilities of NT$1.07b due within 12 months, and liabilities of NT$35.4m due beyond 12 months. Offsetting these obligations, it had cash of NT$413.2m as well as receivables valued at NT$439.9m due within 12 months. So its liabilities outweigh the sum of its cash and (near-term) receivables by NT$249.1m.
Given TUL has a market capitalization of NT$4.36b, it's hard to believe these liabilities pose much threat. But there are sufficient liabilities that we would certainly recommend shareholders continue to monitor the balance sheet, going forward. Despite its noteworthy liabilities, TUL boasts net cash, so it's fair to say it does not have a heavy debt load! When analysing debt levels, the balance sheet is the obvious place to start. But you can't view debt in total isolation; since TUL will need earnings to service that debt. So when considering debt, it's definitely worth looking at the earnings trend. Click here for an interactive snapshot.
In the last year TUL wasn't profitable at an EBIT level, but managed to grow its revenue by 30%, to NT$3.3b. With any luck the company will be able to grow its way to profitability.
So How Risky Is TUL?
Although TUL had an earnings before interest and tax (EBIT) loss over the last twelve months, it generated positive free cash flow of NT$148m. So although it is loss-making, it doesn't seem to have too much near-term balance sheet risk, keeping in mind the net cash. The good news for TUL shareholders is that its revenue growth is strong, making it easier to raise capital if need be. But we still think it's somewhat risky. There's no doubt that we learn most about debt from the balance sheet. But ultimately, every company can contain risks that exist outside of the balance sheet. For example, we've discovered 2 warning signs for TUL that you should be aware of before investing here.
When all is said and done, sometimes its easier to focus on companies that don't even need debt. Readers can access a list of growth stocks with zero net debt 100% free, right now.
If you’re looking to trade TUL, open an account with the lowest-cost* platform trusted by professionals, Interactive Brokers. Their clients from over 200 countries and territories trade stocks, options, futures, forex, bonds and funds worldwide from a single integrated account. Promoted
Valuation is complex, but we're here to simplify it.
Discover if TUL might be undervalued or overvalued with our detailed analysis, featuring fair value estimates, potential risks, dividends, insider trades, and its financial condition.
Access Free AnalysisThis article by Simply Wall St is general in nature. It does not constitute a recommendation to buy or sell any stock, and does not take account of your objectives, or your financial situation. We aim to bring you long-term focused analysis driven by fundamental data. Note that our analysis may not factor in the latest price-sensitive company announcements or qualitative material. Simply Wall St has no position in any stocks mentioned.
*Interactive Brokers Rated Lowest Cost Broker by StockBrokers.com Annual Online Review 2020
Have feedback on this article? Concerned about the content? Get in touch with us directly. Alternatively, email editorial-team (at) simplywallst.com.
About TPEX:6150
Acceptable track record and slightly overvalued.
Similar Companies
Market Insights
Weekly Picks


Crazy Undervalued 42 Baggers Silver Play (Active & Running Mine)


Fiducian: Compliance Clouds or Value Opportunity?

Willamette Valley Vineyards (WVVI): Not-So-Great Value
Recently Updated Narratives

THE KINGDOM OF BROWN GOODS: WHY MGPI IS BEING CRUSHED BY INVENTORY & PRIMED FOR RESURRECTION


The "Molecular Pencil": Why Beam's Technology is Built to Win


ADNOC Gas future shines with a 21.4% revenue surge
Popular Narratives


MicroVision will explode future revenue by 380.37% with a vision towards success


NVDA: Expanding AI Demand Will Drive Major Data Center Investments Through 2026


