
Advertisement
- Taiwan
- /
- Semiconductors
- /
- TPEX:6417
Here's What To Make Of Securitag Assembly Group's (GTSM:6417) Returns On Capital
Did you know there are some financial metrics that can provide clues of a potential multi-bagger? Ideally, a business will show two trends; firstly a growing return on capital employed (ROCE) and secondly, an increasing amount of capital employed. Ultimately, this demonstrates that it's a business that is reinvesting profits at increasing rates of return. In light of that, when we looked at Securitag Assembly Group (GTSM:6417) and its ROCE trend, we weren't exactly thrilled.
What is Return On Capital Employed (ROCE)?
For those that aren't sure what ROCE is, it measures the amount of pre-tax profits a company can generate from the capital employed in its business. Analysts use this formula to calculate it for Securitag Assembly Group:
Return on Capital Employed = Earnings Before Interest and Tax (EBIT) ÷ (Total Assets - Current Liabilities)
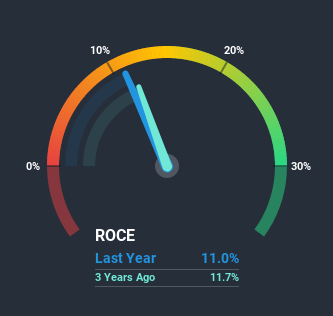
0.11 = NT$117m ÷ (NT$1.3b - NT$181m) (Based on the trailing twelve months to September 2020).
Therefore, Securitag Assembly Group has an ROCE of 11%. By itself that's a normal return on capital and it's in line with the industry's average returns of 11%.
Check out our latest analysis for Securitag Assembly Group
While the past is not representative of the future, it can be helpful to know how a company has performed historically, which is why we have this chart above. If you want to delve into the historical earnings, revenue and cash flow of Securitag Assembly Group, check out these free graphs here.
What The Trend Of ROCE Can Tell Us
In terms of Securitag Assembly Group's historical ROCE movements, the trend isn't fantastic. Around five years ago the returns on capital were 14%, but since then they've fallen to 11%. On the other hand, the company has been employing more capital without a corresponding improvement in sales in the last year, which could suggest these investments are longer term plays. It may take some time before the company starts to see any change in earnings from these investments.
On a side note, Securitag Assembly Group has done well to pay down its current liabilities to 14% of total assets. So we could link some of this to the decrease in ROCE. What's more, this can reduce some aspects of risk to the business because now the company's suppliers or short-term creditors are funding less of its operations. Since the business is basically funding more of its operations with it's own money, you could argue this has made the business less efficient at generating ROCE.
Our Take On Securitag Assembly Group's ROCE
In summary, Securitag Assembly Group is reinvesting funds back into the business for growth but unfortunately it looks like sales haven't increased much just yet. Investors must think there's better things to come because the stock has knocked it out of the park, delivering a 131% gain to shareholders who have held over the last five years. However, unless these underlying trends turn more positive, we wouldn't get our hopes up too high.
On a final note, we found 2 warning signs for Securitag Assembly Group (1 is concerning) you should be aware of.
If you want to search for solid companies with great earnings, check out this free list of companies with good balance sheets and impressive returns on equity.
If you decide to trade Securitag Assembly Group, use the lowest-cost* platform that is rated #1 Overall by Barron’s, Interactive Brokers. Trade stocks, options, futures, forex, bonds and funds on 135 markets, all from a single integrated account. Promoted
New: Manage All Your Stock Portfolios in One Place
We've created the ultimate portfolio companion for stock investors, and it's free.
• Connect an unlimited number of Portfolios and see your total in one currency
• Be alerted to new Warning Signs or Risks via email or mobile
• Track the Fair Value of your stocks
This article by Simply Wall St is general in nature. It does not constitute a recommendation to buy or sell any stock, and does not take account of your objectives, or your financial situation. We aim to bring you long-term focused analysis driven by fundamental data. Note that our analysis may not factor in the latest price-sensitive company announcements or qualitative material. Simply Wall St has no position in any stocks mentioned.
*Interactive Brokers Rated Lowest Cost Broker by StockBrokers.com Annual Online Review 2020
Have feedback on this article? Concerned about the content? Get in touch with us directly. Alternatively, email editorial-team (at) simplywallst.com.
About TPEX:6417
Securitag Assembly Group
Engages in the manufacture and sale of RFID transponders in Taiwan and internationally.
Solid track record with excellent balance sheet and pays a dividend.
Market Insights

Advertisement
Weekly Picks
RO


RockeTeller on Santacruz Silver Mining ·
Crazy Undervalued 42 Baggers Silver Play (Active & Running Mine)
Fair Value:CA$8696.7% undervalued
61 followersusers have followed this narrative
7 commentsusers have commented on this narrative
18 likesusers have liked this narrative
RO


Robbo on Fiducian Group ·
Fiducian: Compliance Clouds or Value Opportunity?
Fair Value:AU$122.0% undervalued
9 followersusers have followed this narrative
0 commentsusers have commented on this narrative
0 likesusers have liked this narrative
WO

woodworthfund on Willamette Valley Vineyards ·
Willamette Valley Vineyards (WVVI): Not-So-Great Value
Fair Value:US$242.5% overvalued
10 followersusers have followed this narrative
0 commentsusers have commented on this narrative
1 likeusers have liked this narrative
Recently Updated Narratives
CO

composite32 on SEGRO ·
SEGRO's Revenue to Rise 14.7% Amidst Optimistic Growth Plans
Fair Value:UK£9.3924.7% undervalued
0 followersusers have followed this narrative
0 commentsusers have commented on this narrative
0 likesusers have liked this narrative
PI

PicaCoder on Microsoft ·
After the AI Party: A Sobering Look at Microsoft's Future
Fair Value:US$42015.0% overvalued
59 followersusers have followed this narrative
12 commentsusers have commented on this narrative
0 likesusers have liked this narrative
WO

woodworthfund on MGP Ingredients ·
THE KINGDOM OF BROWN GOODS: WHY MGPI IS BEING CRUSHED BY INVENTORY & PRIMED FOR RESURRECTION
Fair Value:US$4035.8% undervalued
3 followersusers have followed this narrative
0 commentsusers have commented on this narrative
0 likesusers have liked this narrative
Popular Narratives
TH


TheWallstreetKing on MicroVision ·
MicroVision will explode future revenue by 380.37% with a vision towards success
Fair Value:US$6098.5% undervalued
117 followersusers have followed this narrative
11 commentsusers have commented on this narrative
22 likesusers have liked this narrative
AN


AnalystConsensusTarget on NVIDIA ·
NVDA: Expanding AI Demand Will Drive Major Data Center Investments Through 2026
Fair Value:US$250.3927.2% undervalued
959 followersusers have followed this narrative
6 commentsusers have commented on this narrative
25 likesusers have liked this narrative
RO
RockeTeller on Santacruz Silver Mining ·
Crazy Undervalued 42 Baggers Silver Play (Active & Running Mine)
Fair Value:CA$8696.7% undervalued
61 followersusers have followed this narrative
7 commentsusers have commented on this narrative
18 likesusers have liked this narrative
