

There are a few key trends to look for if we want to identify the next multi-bagger. Firstly, we'd want to identify a growing return on capital employed (ROCE) and then alongside that, an ever-increasing base of capital employed. This shows us that it's a compounding machine, able to continually reinvest its earnings back into the business and generate higher returns. In light of that, when we looked at United Radiant Technology (GTSM:5315) and its ROCE trend, we weren't exactly thrilled.
Return On Capital Employed (ROCE): What is it?
For those who don't know, ROCE is a measure of a company's yearly pre-tax profit (its return), relative to the capital employed in the business. To calculate this metric for United Radiant Technology, this is the formula:
Return on Capital Employed = Earnings Before Interest and Tax (EBIT) ÷ (Total Assets - Current Liabilities)
0.051 = NT$71m ÷ (NT$1.8b - NT$368m) (Based on the trailing twelve months to September 2020).
So, United Radiant Technology has an ROCE of 5.1%. Ultimately, that's a low return and it under-performs the Semiconductor industry average of 11%.
Check out our latest analysis for United Radiant Technology
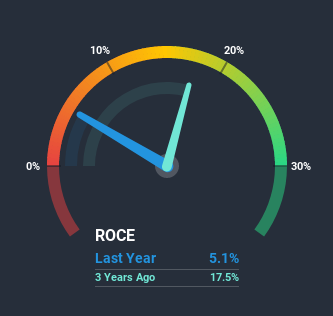
Historical performance is a great place to start when researching a stock so above you can see the gauge for United Radiant Technology's ROCE against it's prior returns. If you want to delve into the historical earnings, revenue and cash flow of United Radiant Technology, check out these free graphs here.
So How Is United Radiant Technology's ROCE Trending?
When we looked at the ROCE trend at United Radiant Technology, we didn't gain much confidence. Over the last five years, returns on capital have decreased to 5.1% from 29% five years ago. Meanwhile, the business is utilizing more capital but this hasn't moved the needle much in terms of sales in the past 12 months, so this could reflect longer term investments. It's worth keeping an eye on the company's earnings from here on to see if these investments do end up contributing to the bottom line.
On a related note, United Radiant Technology has decreased its current liabilities to 21% of total assets. So we could link some of this to the decrease in ROCE. What's more, this can reduce some aspects of risk to the business because now the company's suppliers or short-term creditors are funding less of its operations. Some would claim this reduces the business' efficiency at generating ROCE since it is now funding more of the operations with its own money.
The Bottom Line
Bringing it all together, while we're somewhat encouraged by United Radiant Technology's reinvestment in its own business, we're aware that returns are shrinking. And in the last five years, the stock has given away 25% so the market doesn't look too hopeful on these trends strengthening any time soon. Therefore based on the analysis done in this article, we don't think United Radiant Technology has the makings of a multi-bagger.
Since virtually every company faces some risks, it's worth knowing what they are, and we've spotted 4 warning signs for United Radiant Technology (of which 1 makes us a bit uncomfortable!) that you should know about.
If you want to search for solid companies with great earnings, check out this free list of companies with good balance sheets and impressive returns on equity.
If you decide to trade United Radiant Technology, use the lowest-cost* platform that is rated #1 Overall by Barron’s, Interactive Brokers. Trade stocks, options, futures, forex, bonds and funds on 135 markets, all from a single integrated account. Promoted
New: AI Stock Screener & Alerts
Our new AI Stock Screener scans the market every day to uncover opportunities.
• Dividend Powerhouses (3%+ Yield)
• Undervalued Small Caps with Insider Buying
• High growth Tech and AI Companies
Or build your own from over 50 metrics.
This article by Simply Wall St is general in nature. It does not constitute a recommendation to buy or sell any stock, and does not take account of your objectives, or your financial situation. We aim to bring you long-term focused analysis driven by fundamental data. Note that our analysis may not factor in the latest price-sensitive company announcements or qualitative material. Simply Wall St has no position in any stocks mentioned.
*Interactive Brokers Rated Lowest Cost Broker by StockBrokers.com Annual Online Review 2020
Have feedback on this article? Concerned about the content? Get in touch with us directly. Alternatively, email editorial-team (at) simplywallst.com.
About TPEX:5315
United Radiant Technology
Manufactures and sells liquid crystal display panels and modules.
Flawless balance sheet with solid track record.

