- Taiwan
- /
- Semiconductors
- /
- TPEX:3663
ThinTech Materials Technology Co., Ltd.'s (GTSM:3663) Stock Has Shown Weakness Lately But Financial Prospects Look Decent: Is The Market Wrong?
ThinTech Materials Technology (GTSM:3663) has had a rough month with its share price down 16%. But if you pay close attention, you might find that its key financial indicators look quite decent, which could mean that the stock could potentially rise in the long-term given how markets usually reward more resilient long-term fundamentals. In this article, we decided to focus on ThinTech Materials Technology's ROE.
Return on equity or ROE is a key measure used to assess how efficiently a company's management is utilizing the company's capital. Put another way, it reveals the company's success at turning shareholder investments into profits.
View our latest analysis for ThinTech Materials Technology
How Do You Calculate Return On Equity?
ROE can be calculated by using the formula:
Return on Equity = Net Profit (from continuing operations) ÷ Shareholders' Equity
So, based on the above formula, the ROE for ThinTech Materials Technology is:
3.2% = NT$36m ÷ NT$1.1b (Based on the trailing twelve months to September 2020).
The 'return' refers to a company's earnings over the last year. Another way to think of that is that for every NT$1 worth of equity, the company was able to earn NT$0.03 in profit.
What Has ROE Got To Do With Earnings Growth?
We have already established that ROE serves as an efficient profit-generating gauge for a company's future earnings. Based on how much of its profits the company chooses to reinvest or "retain", we are then able to evaluate a company's future ability to generate profits. Assuming everything else remains unchanged, the higher the ROE and profit retention, the higher the growth rate of a company compared to companies that don't necessarily bear these characteristics.
ThinTech Materials Technology's Earnings Growth And 3.2% ROE
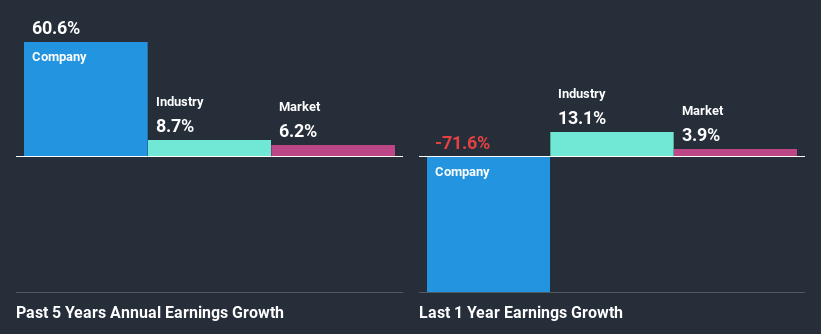
On the face of it, ThinTech Materials Technology's ROE is not much to talk about. We then compared the company's ROE to the broader industry and were disappointed to see that the ROE is lower than the industry average of 11%. In spite of this, ThinTech Materials Technology was able to grow its net income considerably, at a rate of 61% in the last five years. Therefore, there could be other reasons behind this growth. For example, it is possible that the company's management has made some good strategic decisions, or that the company has a low payout ratio.
As a next step, we compared ThinTech Materials Technology's net income growth with the industry, and pleasingly, we found that the growth seen by the company is higher than the average industry growth of 8.7%.

Earnings growth is an important metric to consider when valuing a stock. The investor should try to establish if the expected growth or decline in earnings, whichever the case may be, is priced in. Doing so will help them establish if the stock's future looks promising or ominous. Is ThinTech Materials Technology fairly valued compared to other companies? These 3 valuation measures might help you decide.
Is ThinTech Materials Technology Making Efficient Use Of Its Profits?
ThinTech Materials Technology has a significant three-year median payout ratio of 79%, meaning the company only retains 21% of its income. This implies that the company has been able to achieve high earnings growth despite returning most of its profits to shareholders.
Moreover, ThinTech Materials Technology is determined to keep sharing its profits with shareholders which we infer from its long history of paying a dividend for at least ten years.
Summary
On the whole, we do feel that ThinTech Materials Technology has some positive attributes. While no doubt its earnings growth is pretty substantial, we do feel that the reinvestment rate is pretty low, meaning, the earnings growth number could have been significantly higher had the company been retaining more of its profits. Up till now, we've only made a short study of the company's growth data. To gain further insights into ThinTech Materials Technology's past profit growth, check out this visualization of past earnings, revenue and cash flows.
When trading ThinTech Materials Technology or any other investment, use the platform considered by many to be the Professional's Gateway to the Worlds Market, Interactive Brokers. You get the lowest-cost* trading on stocks, options, futures, forex, bonds and funds worldwide from a single integrated account. Promoted
Valuation is complex, but we're here to simplify it.
Discover if ThinTech Materials Technology might be undervalued or overvalued with our detailed analysis, featuring fair value estimates, potential risks, dividends, insider trades, and its financial condition.
Access Free AnalysisThis article by Simply Wall St is general in nature. It does not constitute a recommendation to buy or sell any stock, and does not take account of your objectives, or your financial situation. We aim to bring you long-term focused analysis driven by fundamental data. Note that our analysis may not factor in the latest price-sensitive company announcements or qualitative material. Simply Wall St has no position in any stocks mentioned.
*Interactive Brokers Rated Lowest Cost Broker by StockBrokers.com Annual Online Review 2020
Have feedback on this article? Concerned about the content? Get in touch with us directly. Alternatively, email editorial-team (at) simplywallst.com.
About TPEX:3663
ThinTech Materials Technology
Designs, manufactures, and sells alloys and optoelectronics materials in Taiwan and internationally.
Adequate balance sheet with low risk.
Market Insights
Weekly Picks


Crazy Undervalued 42 Baggers Silver Play (Active & Running Mine)


Fiducian: Compliance Clouds or Value Opportunity?

Willamette Valley Vineyards (WVVI): Not-So-Great Value
Recently Updated Narratives
China Starch Holdings eyes a revenue growth of 4.66% with a 5-year strategic plan

PSIX The timing of insider sales is a serious question mark


The Great Strategy Swap – Selling "Old Auto" to Buy "Future Light"
Popular Narratives


MicroVision will explode future revenue by 380.37% with a vision towards success


NVDA: Expanding AI Demand Will Drive Major Data Center Investments Through 2026


