Investors Could Be Concerned With Headway Advanced Materials' (TWSE:1776) Returns On Capital

Ignoring the stock price of a company, what are the underlying trends that tell us a business is past the growth phase? A business that's potentially in decline often shows two trends, a return on capital employed (ROCE) that's declining, and a base of capital employed that's also declining. This indicates to us that the business is not only shrinking the size of its net assets, but its returns are falling as well. On that note, looking into Headway Advanced Materials (TWSE:1776), we weren't too upbeat about how things were going.
Understanding Return On Capital Employed (ROCE)
For those that aren't sure what ROCE is, it measures the amount of pre-tax profits a company can generate from the capital employed in its business. Analysts use this formula to calculate it for Headway Advanced Materials:
Return on Capital Employed = Earnings Before Interest and Tax (EBIT) ÷ (Total Assets - Current Liabilities)
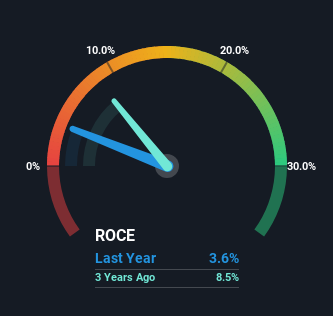
0.036 = NT$48m ÷ (NT$1.7b - NT$343m) (Based on the trailing twelve months to September 2024).
Therefore, Headway Advanced Materials has an ROCE of 3.6%. In absolute terms, that's a low return and it also under-performs the Chemicals industry average of 6.1%.
See our latest analysis for Headway Advanced Materials
While the past is not representative of the future, it can be helpful to know how a company has performed historically, which is why we have this chart above. If you want to delve into the historical earnings , check out these free graphs detailing revenue and cash flow performance of Headway Advanced Materials.
What The Trend Of ROCE Can Tell Us
We are a bit worried about the trend of returns on capital at Headway Advanced Materials. To be more specific, the ROCE was 4.6% five years ago, but since then it has dropped noticeably. And on the capital employed front, the business is utilizing roughly the same amount of capital as it was back then. Since returns are falling and the business has the same amount of assets employed, this can suggest it's a mature business that hasn't had much growth in the last five years. If these trends continue, we wouldn't expect Headway Advanced Materials to turn into a multi-bagger.
On a related note, Headway Advanced Materials has decreased its current liabilities to 20% of total assets. So we could link some of this to the decrease in ROCE. Effectively this means their suppliers or short-term creditors are funding less of the business, which reduces some elements of risk. Some would claim this reduces the business' efficiency at generating ROCE since it is now funding more of the operations with its own money.
The Key Takeaway
In the end, the trend of lower returns on the same amount of capital isn't typically an indication that we're looking at a growth stock. Yet despite these concerning fundamentals, the stock has performed strongly with a 48% return over the last five years, so investors appear very optimistic. In any case, the current underlying trends don't bode well for long term performance so unless they reverse, we'd start looking elsewhere.
If you'd like to know more about Headway Advanced Materials, we've spotted 3 warning signs, and 1 of them is a bit concerning.
If you want to search for solid companies with great earnings, check out this free list of companies with good balance sheets and impressive returns on equity.
Mobile Infrastructure for Defense and Disaster
The next wave in robotics isn't humanoid. Its fully autonomous towers delivering 5G, ISR, and radar in under 30 minutes, anywhere.
Get the investor briefing before the next round of contracts
Sponsored On Behalf of CiTechValuation is complex, but we're here to simplify it.
Discover if Headway Advanced Materials might be undervalued or overvalued with our detailed analysis, featuring fair value estimates, potential risks, dividends, insider trades, and its financial condition.
Access Free AnalysisHave feedback on this article? Concerned about the content? Get in touch with us directly. Alternatively, email editorial-team (at) simplywallst.com.
This article by Simply Wall St is general in nature. We provide commentary based on historical data and analyst forecasts only using an unbiased methodology and our articles are not intended to be financial advice. It does not constitute a recommendation to buy or sell any stock, and does not take account of your objectives, or your financial situation. We aim to bring you long-term focused analysis driven by fundamental data. Note that our analysis may not factor in the latest price-sensitive company announcements or qualitative material. Simply Wall St has no position in any stocks mentioned.
About TWSE:1776
Headway Advanced Materials
Manufactures and sells polyurethane resin and thermoplastic polyurethane pellet products in the Asia-Pacific region.
Flawless balance sheet with moderate risk.
Similar Companies
Market Insights

Weekly Picks

Early mover in a fast growing industry. Likely to experience share price volatility as they scale


A case for CA$31.80 (undiluted), aka 8,616% upside from CA$0.37 (an 86 bagger!).


Moderation and Stabilisation: HOLD: Fair Price based on a 4-year Cycle is $12.08
Recently Updated Narratives

Amazon: Why the World’s Biggest Platform Still Runs on Invisible Economics

Sunrun Stock: When the Energy Transition Collides With the Cost of Capital

Salesforce Stock: AI-Fueled Growth Is Real — But Can Margins Stay This Strong?
Popular Narratives


MicroVision will explode future revenue by 380.37% with a vision towards success


Crazy Undervalued 42 Baggers Silver Play (Active & Running Mine)


