

If you're not sure where to start when looking for the next multi-bagger, there are a few key trends you should keep an eye out for. Amongst other things, we'll want to see two things; firstly, a growing return on capital employed (ROCE) and secondly, an expansion in the company's amount of capital employed. Put simply, these types of businesses are compounding machines, meaning they are continually reinvesting their earnings at ever-higher rates of return. So on that note, Maywufa (TPE:1731) looks quite promising in regards to its trends of return on capital.
Return On Capital Employed (ROCE): What is it?
Just to clarify if you're unsure, ROCE is a metric for evaluating how much pre-tax income (in percentage terms) a company earns on the capital invested in its business. The formula for this calculation on Maywufa is:
Return on Capital Employed = Earnings Before Interest and Tax (EBIT) ÷ (Total Assets - Current Liabilities)
0.08 = NT$172m ÷ (NT$2.4b - NT$298m) (Based on the trailing twelve months to September 2020).
Thus, Maywufa has an ROCE of 8.0%. Ultimately, that's a low return and it under-performs the Personal Products industry average of 14%.
Check out our latest analysis for Maywufa
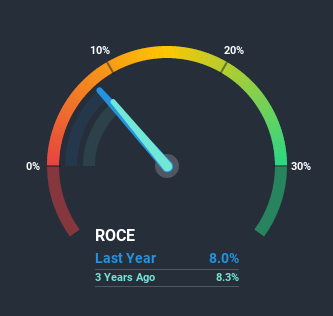
Historical performance is a great place to start when researching a stock so above you can see the gauge for Maywufa's ROCE against it's prior returns. If you'd like to look at how Maywufa has performed in the past in other metrics, you can view this free graph of past earnings, revenue and cash flow.
What Can We Tell From Maywufa's ROCE Trend?
Maywufa has not disappointed with their ROCE growth. Looking at the data, we can see that even though capital employed in the business has remained relatively flat, the ROCE generated has risen by 43% over the last five years. So it's likely that the business is now reaping the full benefits of its past investments, since the capital employed hasn't changed considerably. The company is doing well in that sense, and it's worth investigating what the management team has planned for long term growth prospects.
In another part of our analysis, we noticed that the company's ratio of current liabilities to total assets decreased to 12%, which broadly means the business is relying less on its suppliers or short-term creditors to fund its operations. This tells us that Maywufa has grown its returns without a reliance on increasing their current liabilities, which we're very happy with.In Conclusion...
In summary, we're delighted to see that Maywufa has been able to increase efficiencies and earn higher rates of return on the same amount of capital. And investors seem to expect more of this going forward, since the stock has rewarded shareholders with a 50% return over the last five years. With that being said, we still think the promising fundamentals mean the company deserves some further due diligence.
One more thing to note, we've identified 2 warning signs with Maywufa and understanding them should be part of your investment process.
While Maywufa may not currently earn the highest returns, we've compiled a list of companies that currently earn more than 25% return on equity. Check out this free list here.
When trading Maywufa or any other investment, use the platform considered by many to be the Professional's Gateway to the Worlds Market, Interactive Brokers. You get the lowest-cost* trading on stocks, options, futures, forex, bonds and funds worldwide from a single integrated account. Promoted
If you're looking to trade Maywufa, open an account with the lowest-cost platform trusted by professionals, Interactive Brokers.
With clients in over 200 countries and territories, and access to 160 markets, IBKR lets you trade stocks, options, futures, forex, bonds and funds from a single integrated account.
Enjoy no hidden fees, no account minimums, and FX conversion rates as low as 0.03%, far better than what most brokers offer.
Sponsored ContentNew: Manage All Your Stock Portfolios in One Place
We've created the ultimate portfolio companion for stock investors, and it's free.
• Connect an unlimited number of Portfolios and see your total in one currency
• Be alerted to new Warning Signs or Risks via email or mobile
• Track the Fair Value of your stocks
This article by Simply Wall St is general in nature. It does not constitute a recommendation to buy or sell any stock, and does not take account of your objectives, or your financial situation. We aim to bring you long-term focused analysis driven by fundamental data. Note that our analysis may not factor in the latest price-sensitive company announcements or qualitative material. Simply Wall St has no position in any stocks mentioned.
*Interactive Brokers Rated Lowest Cost Broker by StockBrokers.com Annual Online Review 2020
Have feedback on this article? Concerned about the content? Get in touch with us directly. Alternatively, email editorial-team (at) simplywallst.com.
About TWSE:1731
Maywufa
Manufactures and sells hair and skin care products under the Maywufa brand in Taiwan.
Excellent balance sheet second-rate dividend payer.
Market Insights

Community Narratives


