- Taiwan
- /
- Hospitality
- /
- TWSE:5706
Phoenix Tours International, Inc.'s (TPE:5706) Stock's Been Going Strong: Could Weak Financials Mean The Market Will Coorect Its Share Price?


Phoenix Tours International's (TPE:5706) stock is up by a considerable 16% over the past three months. However, we decided to pay close attention to its weak financials as we are doubtful that the current momentum will keep up, given the scenario. In this article, we decided to focus on Phoenix Tours International's ROE.
Return on Equity or ROE is a test of how effectively a company is growing its value and managing investors’ money. Put another way, it reveals the company's success at turning shareholder investments into profits.
Check out our latest analysis for Phoenix Tours International
How Is ROE Calculated?
The formula for return on equity is:
Return on Equity = Net Profit (from continuing operations) ÷ Shareholders' Equity
So, based on the above formula, the ROE for Phoenix Tours International is:
4.0% = NT$43m ÷ NT$1.1b (Based on the trailing twelve months to September 2020).
The 'return' is the income the business earned over the last year. One way to conceptualize this is that for each NT$1 of shareholders' capital it has, the company made NT$0.04 in profit.
Why Is ROE Important For Earnings Growth?
Thus far, we have learned that ROE measures how efficiently a company is generating its profits. We now need to evaluate how much profit the company reinvests or "retains" for future growth which then gives us an idea about the growth potential of the company. Generally speaking, other things being equal, firms with a high return on equity and profit retention, have a higher growth rate than firms that don’t share these attributes.
Phoenix Tours International's Earnings Growth And 4.0% ROE
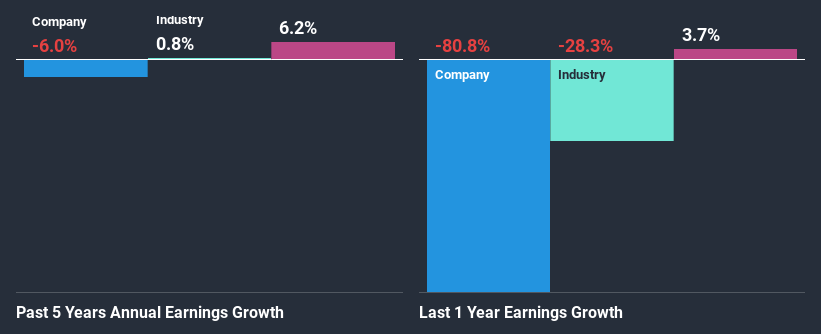
On the face of it, Phoenix Tours International's ROE is not much to talk about. We then compared the company's ROE to the broader industry and were disappointed to see that the ROE is lower than the industry average of 7.1%. Therefore, it might not be wrong to say that the five year net income decline of 6.0% seen by Phoenix Tours International was probably the result of it having a lower ROE. However, there could also be other factors causing the earnings to decline. For example, it is possible that the business has allocated capital poorly or that the company has a very high payout ratio.
However, when we compared Phoenix Tours International's growth with the industry we found that while the company's earnings have been shrinking, the industry has seen an earnings growth of 0.8% in the same period. This is quite worrisome.
Earnings growth is a huge factor in stock valuation. What investors need to determine next is if the expected earnings growth, or the lack of it, is already built into the share price. This then helps them determine if the stock is placed for a bright or bleak future. Is Phoenix Tours International fairly valued compared to other companies? These 3 valuation measures might help you decide.
Is Phoenix Tours International Using Its Retained Earnings Effectively?
With a high three-year median payout ratio of 55% (implying that 45% of the profits are retained), most of Phoenix Tours International's profits are being paid to shareholders, which explains the company's shrinking earnings. With only a little being reinvested into the business, earnings growth would obviously be low or non-existent. You can see the 5 risks we have identified for Phoenix Tours International by visiting our risks dashboard for free on our platform here.
In addition, Phoenix Tours International has been paying dividends over a period of at least ten years suggesting that keeping up dividend payments is way more important to the management even if it comes at the cost of business growth.
Conclusion
In total, we would have a hard think before deciding on any investment action concerning Phoenix Tours International. Because the company is not reinvesting much into the business, and given the low ROE, it's not surprising to see the lack or absence of growth in its earnings. Until now, we have only just grazed the surface of the company's past performance by looking at the company's fundamentals. So it may be worth checking this free detailed graph of Phoenix Tours International's past earnings, as well as revenue and cash flows to get a deeper insight into the company's performance.
If you’re looking to trade Phoenix Tours International, open an account with the lowest-cost* platform trusted by professionals, Interactive Brokers. Their clients from over 200 countries and territories trade stocks, options, futures, forex, bonds and funds worldwide from a single integrated account. Promoted
New: Manage All Your Stock Portfolios in One Place
We've created the ultimate portfolio companion for stock investors, and it's free.
• Connect an unlimited number of Portfolios and see your total in one currency
• Be alerted to new Warning Signs or Risks via email or mobile
• Track the Fair Value of your stocks
This article by Simply Wall St is general in nature. It does not constitute a recommendation to buy or sell any stock, and does not take account of your objectives, or your financial situation. We aim to bring you long-term focused analysis driven by fundamental data. Note that our analysis may not factor in the latest price-sensitive company announcements or qualitative material. Simply Wall St has no position in any stocks mentioned.
*Interactive Brokers Rated Lowest Cost Broker by StockBrokers.com Annual Online Review 2020
Have feedback on this article? Concerned about the content? Get in touch with us directly. Alternatively, email editorial-team@simplywallst.com.
About TWSE:5706
Flawless balance sheet second-rate dividend payer.
Market Insights

Community Narratives


