- Taiwan
- /
- Construction
- /
- TWSE:3703
Continental Holdings Corporation (TWSE:3703) Stock's Been Sliding But Fundamentals Look Decent: Will The Market Correct The Share Price In The Future?


With its stock down 16% over the past three months, it is easy to disregard Continental Holdings (TWSE:3703). However, stock prices are usually driven by a company’s financials over the long term, which in this case look pretty respectable. In this article, we decided to focus on Continental Holdings' ROE.
Return on Equity or ROE is a test of how effectively a company is growing its value and managing investors’ money. Put another way, it reveals the company's success at turning shareholder investments into profits.
See our latest analysis for Continental Holdings
How Is ROE Calculated?
The formula for ROE is:
Return on Equity = Net Profit (from continuing operations) ÷ Shareholders' Equity
So, based on the above formula, the ROE for Continental Holdings is:
3.7% = NT$1.2b ÷ NT$31b (Based on the trailing twelve months to June 2024).
The 'return' is the amount earned after tax over the last twelve months. One way to conceptualize this is that for each NT$1 of shareholders' capital it has, the company made NT$0.04 in profit.
What Is The Relationship Between ROE And Earnings Growth?
Thus far, we have learned that ROE measures how efficiently a company is generating its profits. Depending on how much of these profits the company reinvests or "retains", and how effectively it does so, we are then able to assess a company’s earnings growth potential. Generally speaking, other things being equal, firms with a high return on equity and profit retention, have a higher growth rate than firms that don’t share these attributes.
Continental Holdings' Earnings Growth And 3.7% ROE
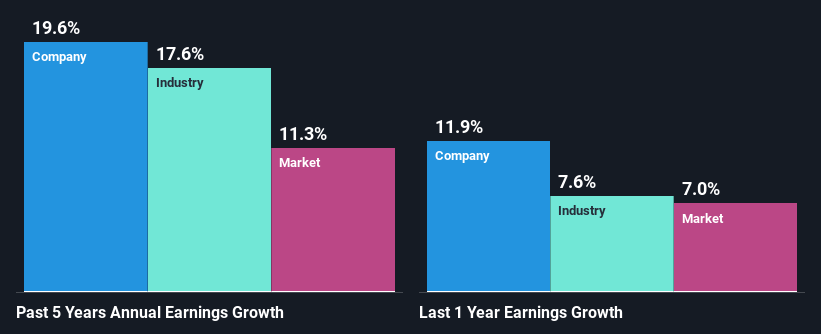
At first glance, Continental Holdings' ROE doesn't look very promising. Next, when compared to the average industry ROE of 13%, the company's ROE leaves us feeling even less enthusiastic. Although, we can see that Continental Holdings saw a modest net income growth of 20% over the past five years. So, the growth in the company's earnings could probably have been caused by other variables. For instance, the company has a low payout ratio or is being managed efficiently.
Next, on comparing Continental Holdings' net income growth with the industry, we found that the company's reported growth is similar to the industry average growth rate of 18% over the last few years.
The basis for attaching value to a company is, to a great extent, tied to its earnings growth. It’s important for an investor to know whether the market has priced in the company's expected earnings growth (or decline). By doing so, they will have an idea if the stock is headed into clear blue waters or if swampy waters await. If you're wondering about Continental Holdings''s valuation, check out this gauge of its price-to-earnings ratio, as compared to its industry.
Is Continental Holdings Making Efficient Use Of Its Profits?
While Continental Holdings has a three-year median payout ratio of 74% (which means it retains 26% of profits), the company has still seen a fair bit of earnings growth in the past, meaning that its high payout ratio hasn't hampered its ability to grow.
Moreover, Continental Holdings is determined to keep sharing its profits with shareholders which we infer from its long history of paying a dividend for at least ten years.
Conclusion
On the whole, we do feel that Continental Holdings has some positive attributes. That is, quite an impressive growth in earnings. However, the low profit retention means that the company's earnings growth could have been higher, had it been reinvesting a higher portion of its profits. Up till now, we've only made a short study of the company's growth data. To gain further insights into Continental Holdings' past profit growth, check out this visualization of past earnings, revenue and cash flows.
New: AI Stock Screener & Alerts
Our new AI Stock Screener scans the market every day to uncover opportunities.
• Dividend Powerhouses (3%+ Yield)
• Undervalued Small Caps with Insider Buying
• High growth Tech and AI Companies
Or build your own from over 50 metrics.
Have feedback on this article? Concerned about the content? Get in touch with us directly. Alternatively, email editorial-team (at) simplywallst.com.
This article by Simply Wall St is general in nature. We provide commentary based on historical data and analyst forecasts only using an unbiased methodology and our articles are not intended to be financial advice. It does not constitute a recommendation to buy or sell any stock, and does not take account of your objectives, or your financial situation. We aim to bring you long-term focused analysis driven by fundamental data. Note that our analysis may not factor in the latest price-sensitive company announcements or qualitative material. Simply Wall St has no position in any stocks mentioned.
About TWSE:3703
Continental Holdings
Engages in civil and building construction, real estate development, environmental project development, and water treatment businesses in Taiwan and internationally.
Average dividend payer low.

