Reflecting on Taipei Star Bank's (GTSM:5863) Share Price Returns Over The Last Year


Investors can approximate the average market return by buying an index fund. But if you buy individual stocks, you can do both better or worse than that. That downside risk was realized by Taipei Star Bank (GTSM:5863) shareholders over the last year, as the share price declined 18%. That's disappointing when you consider the market returned 24%. On the other hand, the stock is actually up 9.3% over three years.
Check out our latest analysis for Taipei Star Bank
While markets are a powerful pricing mechanism, share prices reflect investor sentiment, not just underlying business performance. One way to examine how market sentiment has changed over time is to look at the interaction between a company's share price and its earnings per share (EPS).
During the unfortunate twelve months during which the Taipei Star Bank share price fell, it actually saw its earnings per share (EPS) improve by 13%. Of course, the situation might betray previous over-optimism about growth.
It's fair to say that the share price does not seem to be reflecting the EPS growth. So it's well worth checking out some other metrics, too.
We don't see any weakness in the Taipei Star Bank's dividend so the steady payout can't really explain the share price drop. The revenue trend doesn't seem to explain why the share price is down. Of course, it could simply be that it simply fell short of the market consensus expectations.
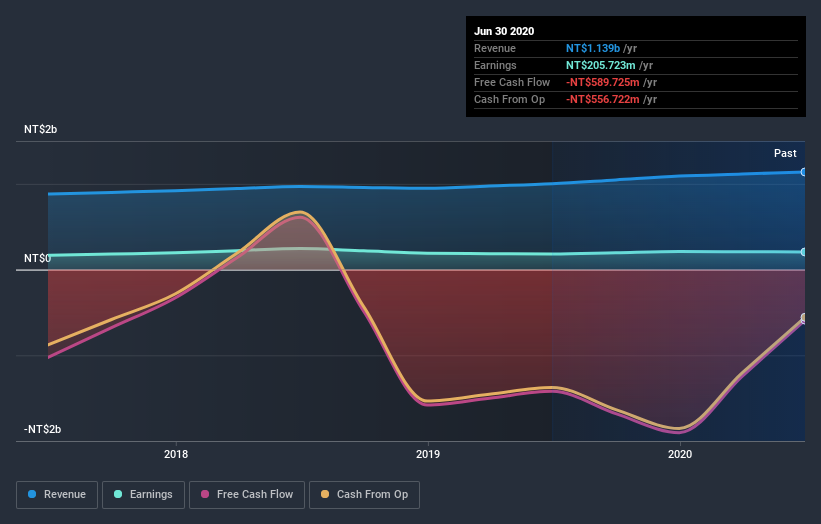
The company's revenue and earnings (over time) are depicted in the image below (click to see the exact numbers).
Take a more thorough look at Taipei Star Bank's financial health with this free report on its balance sheet.
What About Dividends?
When looking at investment returns, it is important to consider the difference between total shareholder return (TSR) and share price return. The TSR incorporates the value of any spin-offs or discounted capital raisings, along with any dividends, based on the assumption that the dividends are reinvested. It's fair to say that the TSR gives a more complete picture for stocks that pay a dividend. We note that for Taipei Star Bank the TSR over the last year was -14%, which is better than the share price return mentioned above. This is largely a result of its dividend payments!
A Different Perspective
Taipei Star Bank shareholders are down 14% for the year (even including dividends), but the market itself is up 24%. Even the share prices of good stocks drop sometimes, but we want to see improvements in the fundamental metrics of a business, before getting too interested. Longer term investors wouldn't be so upset, since they would have made 6%, each year, over five years. If the fundamental data continues to indicate long term sustainable growth, the current sell-off could be an opportunity worth considering. It's always interesting to track share price performance over the longer term. But to understand Taipei Star Bank better, we need to consider many other factors. To that end, you should be aware of the 1 warning sign we've spotted with Taipei Star Bank .
For those who like to find winning investments this free list of growing companies with recent insider purchasing, could be just the ticket.
Please note, the market returns quoted in this article reflect the market weighted average returns of stocks that currently trade on TW exchanges.
If you decide to trade Taipei Star Bank, use the lowest-cost* platform that is rated #1 Overall by Barron’s, Interactive Brokers. Trade stocks, options, futures, forex, bonds and funds on 135 markets, all from a single integrated account. Promoted
Valuation is complex, but we're here to simplify it.
Discover if Taipei Star Bank might be undervalued or overvalued with our detailed analysis, featuring fair value estimates, potential risks, dividends, insider trades, and its financial condition.
Access Free AnalysisThis article by Simply Wall St is general in nature. It does not constitute a recommendation to buy or sell any stock, and does not take account of your objectives, or your financial situation. We aim to bring you long-term focused analysis driven by fundamental data. Note that our analysis may not factor in the latest price-sensitive company announcements or qualitative material. Simply Wall St has no position in any stocks mentioned.
*Interactive Brokers Rated Lowest Cost Broker by StockBrokers.com Annual Online Review 2020
Have feedback on this article? Concerned about the content? Get in touch with us directly. Alternatively, email editorial-team@simplywallst.com.
About TPEX:5863
Taipei Star Bank
Provides various banking products and services in Taiwan.
Flawless balance sheet with proven track record.
Market Insights

Community Narratives


