
Advertisement
These 4 Measures Indicate That COSCO SHIPPING International (Singapore) (SGX:F83) Is Using Debt Extensively

The external fund manager backed by Berkshire Hathaway's Charlie Munger, Li Lu, makes no bones about it when he says 'The biggest investment risk is not the volatility of prices, but whether you will suffer a permanent loss of capital.' When we think about how risky a company is, we always like to look at its use of debt, since debt overload can lead to ruin. We can see that COSCO SHIPPING International (Singapore) Co., Ltd. (SGX:F83) does use debt in its business. But the real question is whether this debt is making the company risky.
Why Does Debt Bring Risk?
Debt assists a business until the business has trouble paying it off, either with new capital or with free cash flow. Ultimately, if the company can't fulfill its legal obligations to repay debt, shareholders could walk away with nothing. However, a more frequent (but still costly) occurrence is where a company must issue shares at bargain-basement prices, permanently diluting shareholders, just to shore up its balance sheet. Having said that, the most common situation is where a company manages its debt reasonably well - and to its own advantage. The first thing to do when considering how much debt a business uses is to look at its cash and debt together.
Check out our latest analysis for COSCO SHIPPING International (Singapore)
What Is COSCO SHIPPING International (Singapore)'s Debt?
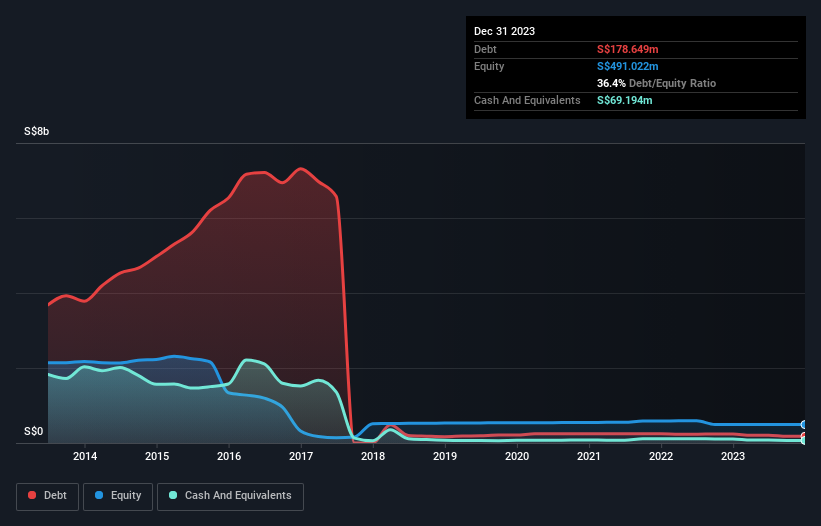
As you can see below, COSCO SHIPPING International (Singapore) had S$178.6m of debt at December 2023, down from S$237.6m a year prior. On the flip side, it has S$69.2m in cash leading to net debt of about S$109.5m.
How Healthy Is COSCO SHIPPING International (Singapore)'s Balance Sheet?
Zooming in on the latest balance sheet data, we can see that COSCO SHIPPING International (Singapore) had liabilities of S$67.6m due within 12 months and liabilities of S$297.7m due beyond that. Offsetting these obligations, it had cash of S$69.2m as well as receivables valued at S$40.6m due within 12 months. So its liabilities outweigh the sum of its cash and (near-term) receivables by S$255.5m.
This is a mountain of leverage relative to its market capitalization of S$353.8m. This suggests shareholders would be heavily diluted if the company needed to shore up its balance sheet in a hurry.
We use two main ratios to inform us about debt levels relative to earnings. The first is net debt divided by earnings before interest, tax, depreciation, and amortization (EBITDA), while the second is how many times its earnings before interest and tax (EBIT) covers its interest expense (or its interest cover, for short). Thus we consider debt relative to earnings both with and without depreciation and amortization expenses.
Even though COSCO SHIPPING International (Singapore)'s debt is only 2.1, its interest cover is really very low at 0.95. The main reason for this is that it has such high depreciation and amortisation. While companies often boast that these charges are non-cash, most such businesses will therefore require ongoing investment (that is not expensed.) In any case, it's safe to say the company has meaningful debt. The bad news is that COSCO SHIPPING International (Singapore) saw its EBIT decline by 10% over the last year. If earnings continue to decline at that rate then handling the debt will be more difficult than taking three children under 5 to a fancy pants restaurant. There's no doubt that we learn most about debt from the balance sheet. But it is COSCO SHIPPING International (Singapore)'s earnings that will influence how the balance sheet holds up in the future. So if you're keen to discover more about its earnings, it might be worth checking out this graph of its long term earnings trend.
Finally, while the tax-man may adore accounting profits, lenders only accept cold hard cash. So it's worth checking how much of that EBIT is backed by free cash flow. Happily for any shareholders, COSCO SHIPPING International (Singapore) actually produced more free cash flow than EBIT over the last three years. That sort of strong cash conversion gets us as excited as the crowd when the beat drops at a Daft Punk concert.
Our View
COSCO SHIPPING International (Singapore)'s interest cover and EBIT growth rate definitely weigh on it, in our esteem. But its conversion of EBIT to free cash flow tells a very different story, and suggests some resilience. Taking the abovementioned factors together we do think COSCO SHIPPING International (Singapore)'s debt poses some risks to the business. So while that leverage does boost returns on equity, we wouldn't really want to see it increase from here. When analysing debt levels, the balance sheet is the obvious place to start. But ultimately, every company can contain risks that exist outside of the balance sheet. To that end, you should be aware of the 1 warning sign we've spotted with COSCO SHIPPING International (Singapore) .
At the end of the day, it's often better to focus on companies that are free from net debt. You can access our special list of such companies (all with a track record of profit growth). It's free.
New: AI Stock Screener & Alerts
Our new AI Stock Screener scans the market every day to uncover opportunities.
• Dividend Powerhouses (3%+ Yield)
• Undervalued Small Caps with Insider Buying
• High growth Tech and AI Companies
Or build your own from over 50 metrics.
Have feedback on this article? Concerned about the content? Get in touch with us directly. Alternatively, email editorial-team (at) simplywallst.com.
This article by Simply Wall St is general in nature. We provide commentary based on historical data and analyst forecasts only using an unbiased methodology and our articles are not intended to be financial advice. It does not constitute a recommendation to buy or sell any stock, and does not take account of your objectives, or your financial situation. We aim to bring you long-term focused analysis driven by fundamental data. Note that our analysis may not factor in the latest price-sensitive company announcements or qualitative material. Simply Wall St has no position in any stocks mentioned.
About SGX:F83
COSCO SHIPPING International (Singapore)
An investment holding company, provides integrated logistics services in South and Southeast Asia.
Proven track record with mediocre balance sheet.
Similar Companies
Market Insights


Advertisement
Community Narratives
Nike's Direct-to-Consumer Focus Will Drive Future Growth
Fair Value US$87.90|18.2% undervalued
UN
Community Contributor
Novo Nordisk will dominate GLP-1 market with Ozempic and Wegovy growth
Fair Value US$89.59|12.1% undervalued
BE
Community Contributor
Rheinmetall could get 20-25% of EU-NATO 3%-GDP defence spending
Fair Value €7.57k|82.8% undervalued
NO
Community Contributor