
Howard Marks put it nicely when he said that, rather than worrying about share price volatility, 'The possibility of permanent loss is the risk I worry about... and every practical investor I know worries about.' So it might be obvious that you need to consider debt, when you think about how risky any given stock is, because too much debt can sink a company. Importantly, Vibrant Group Limited (SGX:F01) does carry debt. But the real question is whether this debt is making the company risky.
When Is Debt A Problem?
Debt and other liabilities become risky for a business when it cannot easily fulfill those obligations, either with free cash flow or by raising capital at an attractive price. Ultimately, if the company can't fulfill its legal obligations to repay debt, shareholders could walk away with nothing. However, a more common (but still painful) scenario is that it has to raise new equity capital at a low price, thus permanently diluting shareholders. By replacing dilution, though, debt can be an extremely good tool for businesses that need capital to invest in growth at high rates of return. When we examine debt levels, we first consider both cash and debt levels, together.
See our latest analysis for Vibrant Group
How Much Debt Does Vibrant Group Carry?
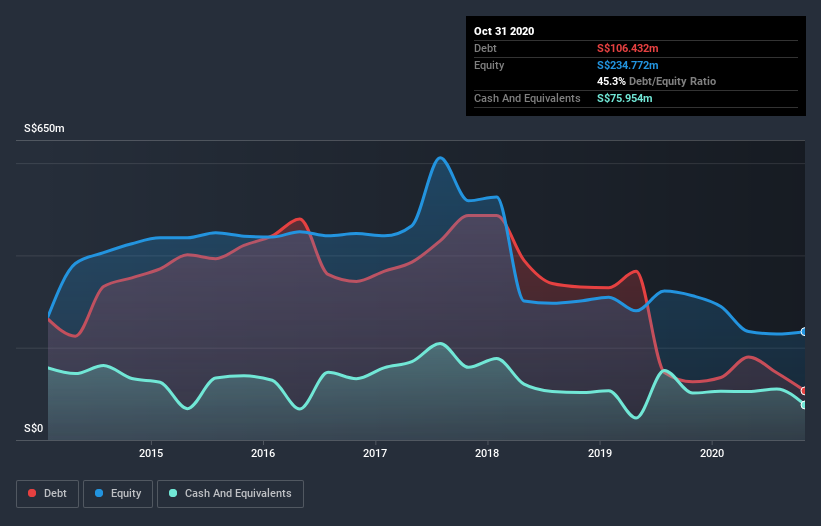
The image below, which you can click on for greater detail, shows that Vibrant Group had debt of S$106.4m at the end of October 2020, a reduction from S$126.2m over a year. However, because it has a cash reserve of S$76.0m, its net debt is less, at about S$30.5m.
How Healthy Is Vibrant Group's Balance Sheet?
We can see from the most recent balance sheet that Vibrant Group had liabilities of S$139.9m falling due within a year, and liabilities of S$212.8m due beyond that. Offsetting these obligations, it had cash of S$76.0m as well as receivables valued at S$60.0m due within 12 months. So its liabilities outweigh the sum of its cash and (near-term) receivables by S$216.7m.
This deficit casts a shadow over the S$68.6m company, like a colossus towering over mere mortals. So we'd watch its balance sheet closely, without a doubt. After all, Vibrant Group would likely require a major re-capitalisation if it had to pay its creditors today. When analysing debt levels, the balance sheet is the obvious place to start. But it is Vibrant Group's earnings that will influence how the balance sheet holds up in the future. So when considering debt, it's definitely worth looking at the earnings trend. Click here for an interactive snapshot.
Over 12 months, Vibrant Group made a loss at the EBIT level, and saw its revenue drop to S$145m, which is a fall of 4.8%. That's not what we would hope to see.
Caveat Emptor
Importantly, Vibrant Group had an earnings before interest and tax (EBIT) loss over the last year. Indeed, it lost a very considerable S$17m at the EBIT level. Combining this information with the significant liabilities we already touched on makes us very hesitant about this stock, to say the least. Of course, it may be able to improve its situation with a bit of luck and good execution. Nevertheless, we would not bet on it given that it lost S$22m in just last twelve months, and it doesn't have much by way of liquid assets. So we think this stock is quite risky. We'd prefer to pass. There's no doubt that we learn most about debt from the balance sheet. However, not all investment risk resides within the balance sheet - far from it. To that end, you should learn about the 4 warning signs we've spotted with Vibrant Group (including 1 which is a bit concerning) .
When all is said and done, sometimes its easier to focus on companies that don't even need debt. Readers can access a list of growth stocks with zero net debt 100% free, right now.
If you’re looking to trade Vibrant Group, open an account with the lowest-cost* platform trusted by professionals, Interactive Brokers. Their clients from over 200 countries and territories trade stocks, options, futures, forex, bonds and funds worldwide from a single integrated account. Promoted
The New Payments ETF Is Live on NASDAQ:
Money is moving to real-time rails, and a newly listed ETF now gives investors direct exposure. Fast settlement. Institutional custody. Simple access.
Explore how this launch could reshape portfolios
Sponsored ContentNew: Manage All Your Stock Portfolios in One Place
We've created the ultimate portfolio companion for stock investors, and it's free.
• Connect an unlimited number of Portfolios and see your total in one currency
• Be alerted to new Warning Signs or Risks via email or mobile
• Track the Fair Value of your stocks
This article by Simply Wall St is general in nature. It does not constitute a recommendation to buy or sell any stock, and does not take account of your objectives, or your financial situation. We aim to bring you long-term focused analysis driven by fundamental data. Note that our analysis may not factor in the latest price-sensitive company announcements or qualitative material. Simply Wall St has no position in any stocks mentioned.
*Interactive Brokers Rated Lowest Cost Broker by StockBrokers.com Annual Online Review 2020
Have feedback on this article? Concerned about the content? Get in touch with us directly. Alternatively, email editorial-team (at) simplywallst.com.
About SGX:BIP
Vibrant Group
An investment holding company, engages in the integrated logistics business in Singapore, Malaysia, China, Rest of Asia, the United States, Oceania, Europe, the Middle East, and internationally.
Flawless balance sheet with solid track record.
Similar Companies
Market Insights

Weekly Picks

THE KINGDOM OF BROWN GOODS: WHY MGPI IS BEING CRUSHED BY INVENTORY & PRIMED FOR RESURRECTION


Why Vertical Aerospace (NYSE: EVTL) is Worth Possibly Over 13x its Current Price


The Quiet Giant That Became AI’s Power Grid
Recently Updated Narratives


A tech powerhouse quietly powering the world’s AI infrastructure.


Keppel DC REIT (SGX: AJBU) is a resilient gem in the data center space.
Why Vertical Aerospace (NYSE: EVTL) is Worth Possibly Over 13x its Current Price
Popular Narratives

MicroVision will explode future revenue by 380.37% with a vision towards success


Crazy Undervalued 42 Baggers Silver Play (Active & Running Mine)


