- Singapore
- /
- Tech Hardware
- /
- SGX:C76
We Think Creative Technology (SGX:C76) Can Afford To Drive Business Growth

There's no doubt that money can be made by owning shares of unprofitable businesses. For example, although software-as-a-service business Salesforce.com lost money for years while it grew recurring revenue, if you held shares since 2005, you'd have done very well indeed. Nonetheless, only a fool would ignore the risk that a loss making company burns through its cash too quickly.
So should Creative Technology (SGX:C76) shareholders be worried about its cash burn? In this article, we define cash burn as its annual (negative) free cash flow, which is the amount of money a company spends each year to fund its growth. We'll start by comparing its cash burn with its cash reserves in order to calculate its cash runway.
Check out our latest analysis for Creative Technology
When Might Creative Technology Run Out Of Money?
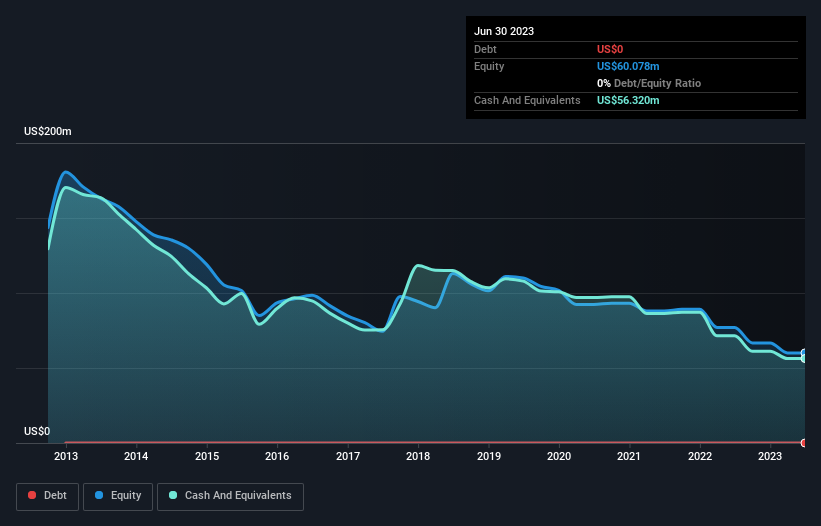
You can calculate a company's cash runway by dividing the amount of cash it has by the rate at which it is spending that cash. As at June 2023, Creative Technology had cash of US$56m and no debt. Importantly, its cash burn was US$12m over the trailing twelve months. So it had a cash runway of about 4.6 years from June 2023. A runway of this length affords the company the time and space it needs to develop the business. You can see how its cash balance has changed over time in the image below.
How Well Is Creative Technology Growing?
We reckon the fact that Creative Technology managed to shrink its cash burn by 38% over the last year is rather encouraging. Unfortunately, however, operating revenue declined by 8.3% during the period. Considering the factors above, the company doesn’t fare badly when it comes to assessing how it is changing over time. Of course, we've only taken a quick look at the stock's growth metrics, here. This graph of historic earnings and revenue shows how Creative Technology is building its business over time.
How Easily Can Creative Technology Raise Cash?
There's no doubt Creative Technology seems to be in a fairly good position, when it comes to managing its cash burn, but even if it's only hypothetical, it's always worth asking how easily it could raise more money to fund growth. Companies can raise capital through either debt or equity. Commonly, a business will sell new shares in itself to raise cash and drive growth. By comparing a company's annual cash burn to its total market capitalisation, we can estimate roughly how many shares it would have to issue in order to run the company for another year (at the same burn rate).
Creative Technology's cash burn of US$12m is about 17% of its US$72m market capitalisation. As a result, we'd venture that the company could raise more cash for growth without much trouble, albeit at the cost of some dilution.
Is Creative Technology's Cash Burn A Worry?
On this analysis of Creative Technology's cash burn, we think its cash runway was reassuring, while its falling revenue has us a bit worried. Considering all the factors discussed in this article, we're not overly concerned about the company's cash burn, although we do think shareholders should keep an eye on how it develops. Taking a deeper dive, we've spotted 2 warning signs for Creative Technology you should be aware of, and 1 of them shouldn't be ignored.
Of course Creative Technology may not be the best stock to buy. So you may wish to see this free collection of companies boasting high return on equity, or this list of stocks that insiders are buying.
The New Payments ETF Is Live on NASDAQ:
Money is moving to real-time rails, and a newly listed ETF now gives investors direct exposure. Fast settlement. Institutional custody. Simple access.
Explore how this launch could reshape portfolios
Sponsored ContentNew: AI Stock Screener & Alerts
Our new AI Stock Screener scans the market every day to uncover opportunities.
• Dividend Powerhouses (3%+ Yield)
• Undervalued Small Caps with Insider Buying
• High growth Tech and AI Companies
Or build your own from over 50 metrics.
Have feedback on this article? Concerned about the content? Get in touch with us directly. Alternatively, email editorial-team (at) simplywallst.com.
This article by Simply Wall St is general in nature. We provide commentary based on historical data and analyst forecasts only using an unbiased methodology and our articles are not intended to be financial advice. It does not constitute a recommendation to buy or sell any stock, and does not take account of your objectives, or your financial situation. We aim to bring you long-term focused analysis driven by fundamental data. Note that our analysis may not factor in the latest price-sensitive company announcements or qualitative material. Simply Wall St has no position in any stocks mentioned.
About SGX:C76
Creative Technology
Engages in the design, manufacture, and distribution of digital entertainment products in Asia Pacific, the Americas, and Europe.
Flawless balance sheet and slightly overvalued.
Similar Companies
Market Insights

Weekly Picks

Early mover in a fast growing industry. Likely to experience share price volatility as they scale


A case for CA$31.80 (undiluted), aka 8,616% upside from CA$0.37 (an 86 bagger!).


Moderation and Stabilisation: HOLD: Fair Price based on a 4-year Cycle is $12.08
Recently Updated Narratives

Airbnb Stock: Platform Growth in a World of Saturation and Scrutiny

Adobe Stock: AI-Fueled ARR Growth Pushes Guidance Higher, But Cost Pressures Loom

Thomson Reuters Stock: When Legal Intelligence Becomes Mission-Critical Infrastructure
Popular Narratives


Crazy Undervalued 42 Baggers Silver Play (Active & Running Mine)


NVDA: Expanding AI Demand Will Drive Major Data Center Investments Through 2026

The AI Infrastructure Giant Grows Into Its Valuation
Trending Discussion


