Wilmar International (SGX:F34) shareholders have endured a 15% loss from investing in the stock three years ago


For many investors, the main point of stock picking is to generate higher returns than the overall market. But in any portfolio, there are likely to be some stocks that fall short of that benchmark. Unfortunately, that's been the case for longer term Wilmar International Limited (SGX:F34) shareholders, since the share price is down 26% in the last three years, falling well short of the market return of around 22%.
So let's have a look and see if the longer term performance of the company has been in line with the underlying business' progress.
We've discovered 2 warning signs about Wilmar International. View them for free.There is no denying that markets are sometimes efficient, but prices do not always reflect underlying business performance. One flawed but reasonable way to assess how sentiment around a company has changed is to compare the earnings per share (EPS) with the share price.
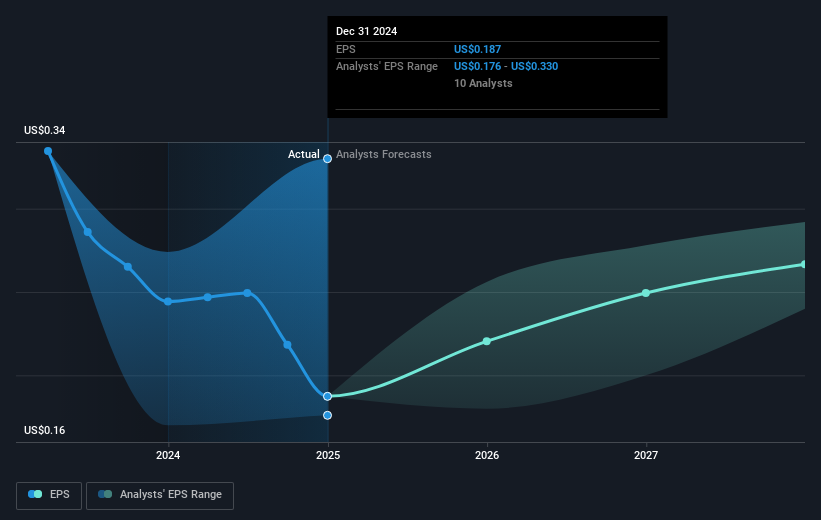
During the three years that the share price fell, Wilmar International's earnings per share (EPS) dropped by 14% each year. This fall in the EPS is worse than the 10% compound annual share price fall. So, despite the prior disappointment, shareholders must have some confidence the situation will improve, longer term.
The graphic below depicts how EPS has changed over time (unveil the exact values by clicking on the image).
It's probably worth noting we've seen significant insider buying in the last quarter, which we consider a positive. That said, we think earnings and revenue growth trends are even more important factors to consider. It might be well worthwhile taking a look at our free report on Wilmar International's earnings, revenue and cash flow.
What About Dividends?
As well as measuring the share price return, investors should also consider the total shareholder return (TSR). Whereas the share price return only reflects the change in the share price, the TSR includes the value of dividends (assuming they were reinvested) and the benefit of any discounted capital raising or spin-off. So for companies that pay a generous dividend, the TSR is often a lot higher than the share price return. We note that for Wilmar International the TSR over the last 3 years was -15%, which is better than the share price return mentioned above. The dividends paid by the company have thusly boosted the total shareholder return.
A Different Perspective
Wilmar International shareholders gained a total return of 2.0% during the year. Unfortunately this falls short of the market return. On the bright side, that's still a gain, and it's actually better than the average return of 0.5% over half a decade This could indicate that the company is winning over new investors, as it pursues its strategy. It's always interesting to track share price performance over the longer term. But to understand Wilmar International better, we need to consider many other factors. To that end, you should learn about the 2 warning signs we've spotted with Wilmar International (including 1 which is a bit concerning) .
If you like to buy stocks alongside management, then you might just love this free list of companies. (Hint: most of them are flying under the radar).
Please note, the market returns quoted in this article reflect the market weighted average returns of stocks that currently trade on Singaporean exchanges.
Valuation is complex, but we're here to simplify it.
Discover if Wilmar International might be undervalued or overvalued with our detailed analysis, featuring fair value estimates, potential risks, dividends, insider trades, and its financial condition.
Access Free AnalysisHave feedback on this article? Concerned about the content? Get in touch with us directly. Alternatively, email editorial-team (at) simplywallst.com.
This article by Simply Wall St is general in nature. We provide commentary based on historical data and analyst forecasts only using an unbiased methodology and our articles are not intended to be financial advice. It does not constitute a recommendation to buy or sell any stock, and does not take account of your objectives, or your financial situation. We aim to bring you long-term focused analysis driven by fundamental data. Note that our analysis may not factor in the latest price-sensitive company announcements or qualitative material. Simply Wall St has no position in any stocks mentioned.
About SGX:F34
Wilmar International
Operates as an agribusiness company in the People's Republic of China, South East Asia, India, Europe, Australia, New Zealand, Africa, and internationally.
Fair value with moderate growth potential.
Similar Companies
Market Insights

Community Narratives

