How Did Wilmar International Limited's (SGX:F34) 8.6% ROE Fare Against The Industry?


While some investors are already well versed in financial metrics (hat tip), this article is for those who would like to learn about Return On Equity (ROE) and why it is important. We'll use ROE to examine Wilmar International Limited (SGX:F34), by way of a worked example.
ROE or return on equity is a useful tool to assess how effectively a company can generate returns on the investment it received from its shareholders. In other words, it is a profitability ratio which measures the rate of return on the capital provided by the company's shareholders.
View our latest analysis for Wilmar International
How Is ROE Calculated?
Return on equity can be calculated by using the formula:
Return on Equity = Net Profit (from continuing operations) ÷ Shareholders' Equity
So, based on the above formula, the ROE for Wilmar International is:
8.6% = US$1.9b ÷ US$22b (Based on the trailing twelve months to June 2023).
The 'return' is the yearly profit. Another way to think of that is that for every SGD1 worth of equity, the company was able to earn SGD0.09 in profit.
Does Wilmar International Have A Good ROE?
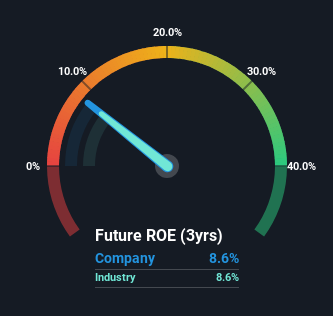
By comparing a company's ROE with its industry average, we can get a quick measure of how good it is. Importantly, this is far from a perfect measure, because companies differ significantly within the same industry classification. The image below shows that Wilmar International has an ROE that is roughly in line with the Food industry average (8.6%).
That isn't amazing, but it is respectable. Even if the ROE is respectable when compared to the industry, its worth checking if the firm's ROE is being aided by high debt levels. If a company takes on too much debt, it is at higher risk of defaulting on interest payments. To know the 2 risks we have identified for Wilmar International visit our risks dashboard for free.
How Does Debt Impact ROE?
Companies usually need to invest money to grow their profits. That cash can come from retained earnings, issuing new shares (equity), or debt. In the first and second cases, the ROE will reflect this use of cash for investment in the business. In the latter case, the debt used for growth will improve returns, but won't affect the total equity. That will make the ROE look better than if no debt was used.
Combining Wilmar International's Debt And Its 8.6% Return On Equity
Wilmar International does use a high amount of debt to increase returns. It has a debt to equity ratio of 1.42. The combination of a rather low ROE and significant use of debt is not particularly appealing. Debt increases risk and reduces options for the company in the future, so you generally want to see some good returns from using it.
Conclusion
Return on equity is one way we can compare its business quality of different companies. In our books, the highest quality companies have high return on equity, despite low debt. If two companies have the same ROE, then I would generally prefer the one with less debt.
But ROE is just one piece of a bigger puzzle, since high quality businesses often trade on high multiples of earnings. It is important to consider other factors, such as future profit growth -- and how much investment is required going forward. So you might want to check this FREE visualization of analyst forecasts for the company.
Of course Wilmar International may not be the best stock to buy. So you may wish to see this free collection of other companies that have high ROE and low debt.
If you're looking to trade Wilmar International, open an account with the lowest-cost platform trusted by professionals, Interactive Brokers.
With clients in over 200 countries and territories, and access to 160 markets, IBKR lets you trade stocks, options, futures, forex, bonds and funds from a single integrated account.
Enjoy no hidden fees, no account minimums, and FX conversion rates as low as 0.03%, far better than what most brokers offer.
Sponsored ContentValuation is complex, but we're here to simplify it.
Discover if Wilmar International might be undervalued or overvalued with our detailed analysis, featuring fair value estimates, potential risks, dividends, insider trades, and its financial condition.
Access Free AnalysisHave feedback on this article? Concerned about the content? Get in touch with us directly. Alternatively, email editorial-team (at) simplywallst.com.
This article by Simply Wall St is general in nature. We provide commentary based on historical data and analyst forecasts only using an unbiased methodology and our articles are not intended to be financial advice. It does not constitute a recommendation to buy or sell any stock, and does not take account of your objectives, or your financial situation. We aim to bring you long-term focused analysis driven by fundamental data. Note that our analysis may not factor in the latest price-sensitive company announcements or qualitative material. Simply Wall St has no position in any stocks mentioned.
About SGX:F34
Wilmar International
Operates as an agribusiness company in the People's Republic of China, South East Asia, India, Europe, Australia, New Zealand, Africa, and internationally.
Good value with moderate growth potential.
Similar Companies
Market Insights


Community Narratives

