First Resources' (SGX:EB5) 12% CAGR outpaced the company's earnings growth over the same three-year period


By buying an index fund, you can roughly match the market return with ease. But many of us dare to dream of bigger returns, and build a portfolio ourselves. For example, First Resources Limited (SGX:EB5) shareholders have seen the share price rise 21% over three years, well in excess of the market return (8.0%, not including dividends). On the other hand, the returns haven't been quite so good recently, with shareholders up just 10% , including dividends .
The past week has proven to be lucrative for First Resources investors, so let's see if fundamentals drove the company's three-year performance.
Check out our latest analysis for First Resources
To quote Buffett, 'Ships will sail around the world but the Flat Earth Society will flourish. There will continue to be wide discrepancies between price and value in the marketplace...' One way to examine how market sentiment has changed over time is to look at the interaction between a company's share price and its earnings per share (EPS).
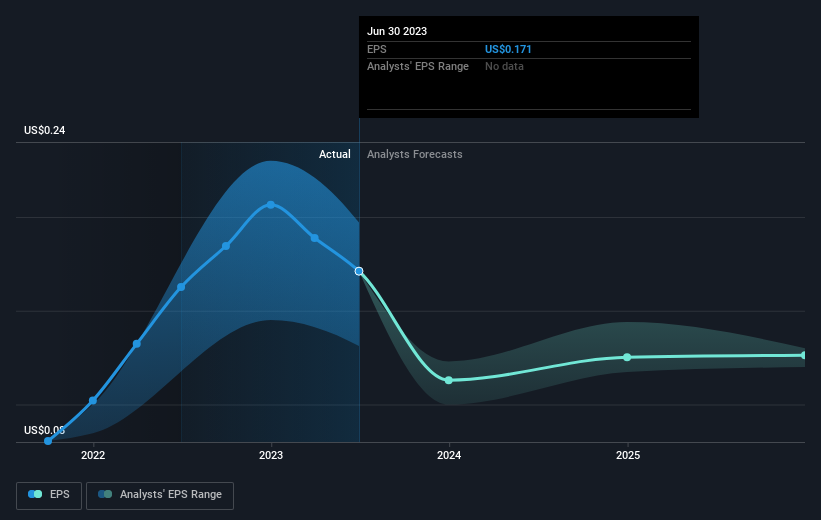
During three years of share price growth, First Resources achieved compound earnings per share growth of 40% per year. The average annual share price increase of 6% is actually lower than the EPS growth. So it seems investors have become more cautious about the company, over time. We'd venture the lowish P/E ratio of 6.50 also reflects the negative sentiment around the stock.
The image below shows how EPS has tracked over time (if you click on the image you can see greater detail).
It is of course excellent to see how First Resources has grown profits over the years, but the future is more important for shareholders. You can see how its balance sheet has strengthened (or weakened) over time in this free interactive graphic.
What About Dividends?
When looking at investment returns, it is important to consider the difference between total shareholder return (TSR) and share price return. Whereas the share price return only reflects the change in the share price, the TSR includes the value of dividends (assuming they were reinvested) and the benefit of any discounted capital raising or spin-off. It's fair to say that the TSR gives a more complete picture for stocks that pay a dividend. As it happens, First Resources' TSR for the last 3 years was 42%, which exceeds the share price return mentioned earlier. This is largely a result of its dividend payments!
A Different Perspective
It's good to see that First Resources has rewarded shareholders with a total shareholder return of 10% in the last twelve months. That's including the dividend. Since the one-year TSR is better than the five-year TSR (the latter coming in at 4% per year), it would seem that the stock's performance has improved in recent times. In the best case scenario, this may hint at some real business momentum, implying that now could be a great time to delve deeper. It's always interesting to track share price performance over the longer term. But to understand First Resources better, we need to consider many other factors. For instance, we've identified 2 warning signs for First Resources (1 is significant) that you should be aware of.
For those who like to find winning investments this free list of growing companies with recent insider purchasing, could be just the ticket.
Please note, the market returns quoted in this article reflect the market weighted average returns of stocks that currently trade on Singaporean exchanges.
New: AI Stock Screener & Alerts
Our new AI Stock Screener scans the market every day to uncover opportunities.
• Dividend Powerhouses (3%+ Yield)
• Undervalued Small Caps with Insider Buying
• High growth Tech and AI Companies
Or build your own from over 50 metrics.
Have feedback on this article? Concerned about the content? Get in touch with us directly. Alternatively, email editorial-team (at) simplywallst.com.
This article by Simply Wall St is general in nature. We provide commentary based on historical data and analyst forecasts only using an unbiased methodology and our articles are not intended to be financial advice. It does not constitute a recommendation to buy or sell any stock, and does not take account of your objectives, or your financial situation. We aim to bring you long-term focused analysis driven by fundamental data. Note that our analysis may not factor in the latest price-sensitive company announcements or qualitative material. Simply Wall St has no position in any stocks mentioned.
About SGX:EB5
First Resources
An investment holding company, engages in the palm oil production activities in Singapore, Indonesia, Europe, China, Malaysia, and internationally.
Very undervalued with flawless balance sheet and pays a dividend.
Similar Companies
Market Insights

Community Narratives

