- Singapore
- /
- Hospitality
- /
- SGX:G13
Earnings growth of 80% over 1 year hasn't been enough to translate into positive returns for Genting Singapore (SGX:G13) shareholders


Passive investing in an index fund is a good way to ensure your own returns roughly match the overall market. Active investors aim to buy stocks that vastly outperform the market - but in the process, they risk under-performance. That downside risk was realized by Genting Singapore Limited (SGX:G13) shareholders over the last year, as the share price declined 13%. That's well below the market decline of 0.5%. Longer term shareholders haven't suffered as badly, since the stock is down a comparatively less painful 0.6% in three years.
After losing 5.9% this past week, it's worth investigating the company's fundamentals to see what we can infer from past performance.
Check out our latest analysis for Genting Singapore
While the efficient markets hypothesis continues to be taught by some, it has been proven that markets are over-reactive dynamic systems, and investors are not always rational. One imperfect but simple way to consider how the market perception of a company has shifted is to compare the change in the earnings per share (EPS) with the share price movement.
During the unfortunate twelve months during which the Genting Singapore share price fell, it actually saw its earnings per share (EPS) improve by 80%. Of course, the situation might betray previous over-optimism about growth.
The divergence between the EPS and the share price is quite notable, during the year. So it's well worth checking out some other metrics, too.
Vibrant companies don't usually cut their dividends, so the recent reduction might help explain why the Genting Singapore share price has been weak.
The image below shows how earnings and revenue have tracked over time (if you click on the image you can see greater detail).
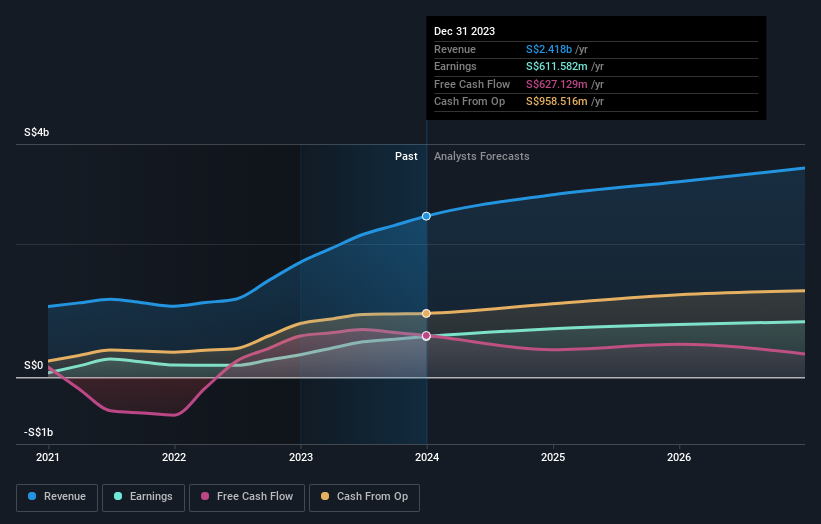
Genting Singapore is a well known stock, with plenty of analyst coverage, suggesting some visibility into future growth. So it makes a lot of sense to check out what analysts think Genting Singapore will earn in the future (free analyst consensus estimates)
What About Dividends?
It is important to consider the total shareholder return, as well as the share price return, for any given stock. Whereas the share price return only reflects the change in the share price, the TSR includes the value of dividends (assuming they were reinvested) and the benefit of any discounted capital raising or spin-off. It's fair to say that the TSR gives a more complete picture for stocks that pay a dividend. As it happens, Genting Singapore's TSR for the last 1 year was -9.6%, which exceeds the share price return mentioned earlier. The dividends paid by the company have thusly boosted the total shareholder return.
A Different Perspective
Investors in Genting Singapore had a tough year, with a total loss of 9.6% (including dividends), against a market gain of about 0.5%. However, keep in mind that even the best stocks will sometimes underperform the market over a twelve month period. Longer term investors wouldn't be so upset, since they would have made 1.1%, each year, over five years. If the fundamental data continues to indicate long term sustainable growth, the current sell-off could be an opportunity worth considering. I find it very interesting to look at share price over the long term as a proxy for business performance. But to truly gain insight, we need to consider other information, too. To that end, you should be aware of the 1 warning sign we've spotted with Genting Singapore .
If you are like me, then you will not want to miss this free list of undervalued small caps that insiders are buying.
Please note, the market returns quoted in this article reflect the market weighted average returns of stocks that currently trade on Singaporean exchanges.
New: Manage All Your Stock Portfolios in One Place
We've created the ultimate portfolio companion for stock investors, and it's free.
• Connect an unlimited number of Portfolios and see your total in one currency
• Be alerted to new Warning Signs or Risks via email or mobile
• Track the Fair Value of your stocks
Have feedback on this article? Concerned about the content? Get in touch with us directly. Alternatively, email editorial-team (at) simplywallst.com.
This article by Simply Wall St is general in nature. We provide commentary based on historical data and analyst forecasts only using an unbiased methodology and our articles are not intended to be financial advice. It does not constitute a recommendation to buy or sell any stock, and does not take account of your objectives, or your financial situation. We aim to bring you long-term focused analysis driven by fundamental data. Note that our analysis may not factor in the latest price-sensitive company announcements or qualitative material. Simply Wall St has no position in any stocks mentioned.
Have feedback on this article? Concerned about the content? Get in touch with us directly. Alternatively, email editorial-team@simplywallst.com
About SGX:G13
Genting Singapore
An investment holding company, primarily engages in the construction, development, and operation of integrated resort destinations in Asia.
Flawless balance sheet with solid track record and pays a dividend.
Similar Companies
Market Insights

Community Narratives


