- Singapore
- /
- Food and Staples Retail
- /
- SGX:OV8
Declining Stock and Solid Fundamentals: Is The Market Wrong About Sheng Siong Group Ltd (SGX:OV8)?


Sheng Siong Group (SGX:OV8) has had a rough three months with its share price down 8.9%. However, stock prices are usually driven by a company’s financial performance over the long term, which in this case looks quite promising. Specifically, we decided to study Sheng Siong Group's ROE in this article.
ROE or return on equity is a useful tool to assess how effectively a company can generate returns on the investment it received from its shareholders. Simply put, it is used to assess the profitability of a company in relation to its equity capital.
View our latest analysis for Sheng Siong Group
How Do You Calculate Return On Equity?
The formula for return on equity is:
Return on Equity = Net Profit (from continuing operations) ÷ Shareholders' Equity
So, based on the above formula, the ROE for Sheng Siong Group is:
28% = S$132m ÷ S$474m (Based on the trailing twelve months to June 2023).
The 'return' is the yearly profit. So, this means that for every SGD1 of its shareholder's investments, the company generates a profit of SGD0.28.
What Has ROE Got To Do With Earnings Growth?
We have already established that ROE serves as an efficient profit-generating gauge for a company's future earnings. We now need to evaluate how much profit the company reinvests or "retains" for future growth which then gives us an idea about the growth potential of the company. Generally speaking, other things being equal, firms with a high return on equity and profit retention, have a higher growth rate than firms that don’t share these attributes.
Sheng Siong Group's Earnings Growth And 28% ROE
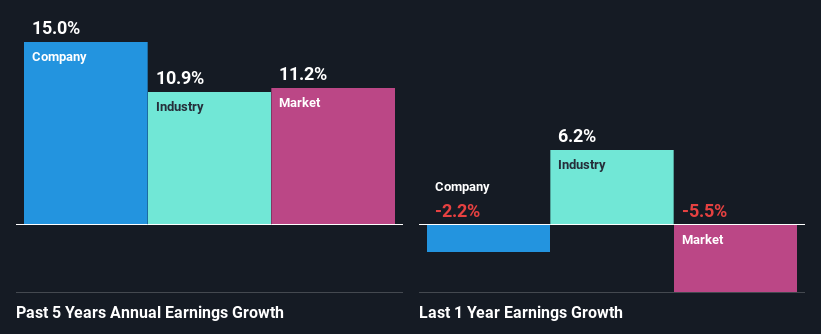
First thing first, we like that Sheng Siong Group has an impressive ROE. Secondly, even when compared to the industry average of 8.8% the company's ROE is quite impressive. Probably as a result of this, Sheng Siong Group was able to see a decent net income growth of 15% over the last five years.
Next, on comparing with the industry net income growth, we found that Sheng Siong Group's growth is quite high when compared to the industry average growth of 11% in the same period, which is great to see.
Earnings growth is an important metric to consider when valuing a stock. What investors need to determine next is if the expected earnings growth, or the lack of it, is already built into the share price. This then helps them determine if the stock is placed for a bright or bleak future. Is Sheng Siong Group fairly valued compared to other companies? These 3 valuation measures might help you decide.
Is Sheng Siong Group Making Efficient Use Of Its Profits?
Sheng Siong Group has a significant three-year median payout ratio of 70%, meaning that it is left with only 30% to reinvest into its business. This implies that the company has been able to achieve decent earnings growth despite returning most of its profits to shareholders.
Besides, Sheng Siong Group has been paying dividends for at least ten years or more. This shows that the company is committed to sharing profits with its shareholders. Based on the latest analysts' estimates, we found that the company's future payout ratio over the next three years is expected to hold steady at 71%. As a result, Sheng Siong Group's ROE is not expected to change by much either, which we inferred from the analyst estimate of 28% for future ROE.
Summary
On the whole, we feel that Sheng Siong Group's performance has been quite good. We are particularly impressed by the considerable earnings growth posted by the company, which was likely backed by its high ROE. While the company is paying out most of its earnings as dividends, it has been able to grow its earnings in spite of it, so that's probably a good sign. Having said that, the company's earnings growth is expected to slow down, as forecasted in the current analyst estimates. Are these analysts expectations based on the broad expectations for the industry, or on the company's fundamentals? Click here to be taken to our analyst's forecasts page for the company.
New: Manage All Your Stock Portfolios in One Place
We've created the ultimate portfolio companion for stock investors, and it's free.
• Connect an unlimited number of Portfolios and see your total in one currency
• Be alerted to new Warning Signs or Risks via email or mobile
• Track the Fair Value of your stocks
Have feedback on this article? Concerned about the content? Get in touch with us directly. Alternatively, email editorial-team (at) simplywallst.com.
This article by Simply Wall St is general in nature. We provide commentary based on historical data and analyst forecasts only using an unbiased methodology and our articles are not intended to be financial advice. It does not constitute a recommendation to buy or sell any stock, and does not take account of your objectives, or your financial situation. We aim to bring you long-term focused analysis driven by fundamental data. Note that our analysis may not factor in the latest price-sensitive company announcements or qualitative material. Simply Wall St has no position in any stocks mentioned.
About SGX:OV8
Sheng Siong Group
An investment holding company, operates a chain of supermarket retail stores in Singapore.
Flawless balance sheet with proven track record and pays a dividend.
