
Advertisement

The external fund manager backed by Berkshire Hathaway's Charlie Munger, Li Lu, makes no bones about it when he says 'The biggest investment risk is not the volatility of prices, but whether you will suffer a permanent loss of capital.' When we think about how risky a company is, we always like to look at its use of debt, since debt overload can lead to ruin. We can see that Koh Brothers Group Limited (SGX:K75) does use debt in its business. But should shareholders be worried about its use of debt?
We've discovered 2 warning signs about Koh Brothers Group. View them for free.What Risk Does Debt Bring?
Debt and other liabilities become risky for a business when it cannot easily fulfill those obligations, either with free cash flow or by raising capital at an attractive price. In the worst case scenario, a company can go bankrupt if it cannot pay its creditors. While that is not too common, we often do see indebted companies permanently diluting shareholders because lenders force them to raise capital at a distressed price. Having said that, the most common situation is where a company manages its debt reasonably well - and to its own advantage. The first thing to do when considering how much debt a business uses is to look at its cash and debt together.
What Is Koh Brothers Group's Debt?
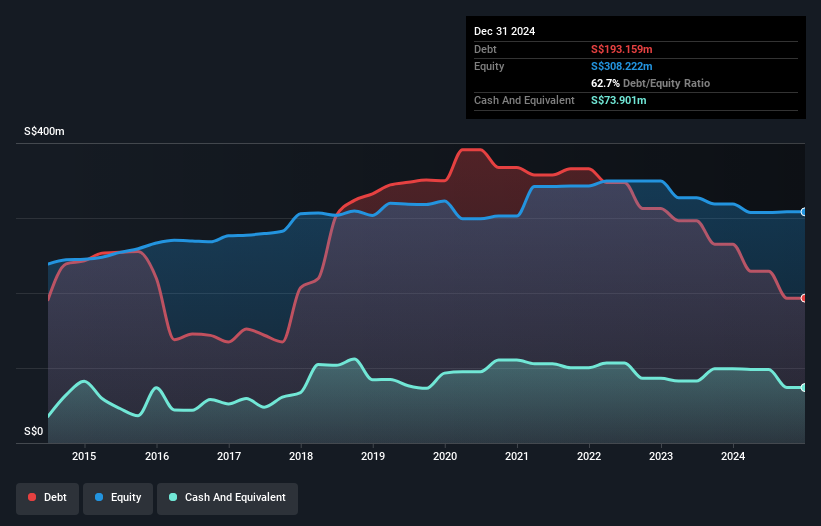
The image below, which you can click on for greater detail, shows that Koh Brothers Group had debt of S$193.2m at the end of December 2024, a reduction from S$265.2m over a year. However, it also had S$73.9m in cash, and so its net debt is S$119.3m.
How Strong Is Koh Brothers Group's Balance Sheet?
We can see from the most recent balance sheet that Koh Brothers Group had liabilities of S$223.3m falling due within a year, and liabilities of S$96.0m due beyond that. Offsetting this, it had S$73.9m in cash and S$194.3m in receivables that were due within 12 months. So its liabilities total S$51.1m more than the combination of its cash and short-term receivables.
This is a mountain of leverage relative to its market capitalization of S$68.5m. Should its lenders demand that it shore up the balance sheet, shareholders would likely face severe dilution. When analysing debt levels, the balance sheet is the obvious place to start. But you can't view debt in total isolation; since Koh Brothers Group will need earnings to service that debt. So if you're keen to discover more about its earnings, it might be worth checking out this graph of its long term earnings trend.
View our latest analysis for Koh Brothers Group
In the last year Koh Brothers Group had a loss before interest and tax, and actually shrunk its revenue by 33%, to S$238m. To be frank that doesn't bode well.
Caveat Emptor
While Koh Brothers Group's falling revenue is about as heartwarming as a wet blanket, arguably its earnings before interest and tax (EBIT) loss is even less appealing. To be specific the EBIT loss came in at S$5.7m. Considering that alongside the liabilities mentioned above does not give us much confidence that company should be using so much debt. So we think its balance sheet is a little strained, though not beyond repair. For example, we would not want to see a repeat of last year's loss of S$5.5m. In the meantime, we consider the stock very risky. There's no doubt that we learn most about debt from the balance sheet. However, not all investment risk resides within the balance sheet - far from it. For example, we've discovered 2 warning signs for Koh Brothers Group (1 doesn't sit too well with us!) that you should be aware of before investing here.
When all is said and done, sometimes its easier to focus on companies that don't even need debt. Readers can access a list of growth stocks with zero net debt 100% free, right now.
Valuation is complex, but we're here to simplify it.
Discover if Koh Brothers Group might be undervalued or overvalued with our detailed analysis, featuring fair value estimates, potential risks, dividends, insider trades, and its financial condition.
Access Free AnalysisHave feedback on this article? Concerned about the content? Get in touch with us directly. Alternatively, email editorial-team (at) simplywallst.com.
This article by Simply Wall St is general in nature. We provide commentary based on historical data and analyst forecasts only using an unbiased methodology and our articles are not intended to be financial advice. It does not constitute a recommendation to buy or sell any stock, and does not take account of your objectives, or your financial situation. We aim to bring you long-term focused analysis driven by fundamental data. Note that our analysis may not factor in the latest price-sensitive company announcements or qualitative material. Simply Wall St has no position in any stocks mentioned.
About SGX:K75
Koh Brothers Group
An investment holding company, provides management services in Singapore, Malaysia, Indonesia, and internationally.
Excellent balance sheet and good value.
Market Insights

Advertisement
Community Narratives

Apple: A Dying Star with an Overpriced Valuation
Fair Value US$177.34|19.1% overvalued
IN
Community Contributor
Avino a case for USD$20 per share within 5 years (assuming $3,500 gold, $100 silver and $4 copper).
Fair Value CA$26.79|86.0% undervalued
AG
Community Contributor
Riding the Defense Boom RENK Sees Revenue Climb at 15% CAGR by FY 2029
Fair Value €69.87|14.3% undervalued
CH
Community Contributor