

David Iben put it well when he said, 'Volatility is not a risk we care about. What we care about is avoiding the permanent loss of capital.' So it seems the smart money knows that debt - which is usually involved in bankruptcies - is a very important factor, when you assess how risky a company is. Importantly, Ovzon AB (publ) (STO:OVZON) does carry debt. But should shareholders be worried about its use of debt?
Why Does Debt Bring Risk?
Generally speaking, debt only becomes a real problem when a company can't easily pay it off, either by raising capital or with its own cash flow. Part and parcel of capitalism is the process of 'creative destruction' where failed businesses are mercilessly liquidated by their bankers. However, a more usual (but still expensive) situation is where a company must dilute shareholders at a cheap share price simply to get debt under control. Of course, plenty of companies use debt to fund growth, without any negative consequences. When we examine debt levels, we first consider both cash and debt levels, together.
See our latest analysis for Ovzon
How Much Debt Does Ovzon Carry?
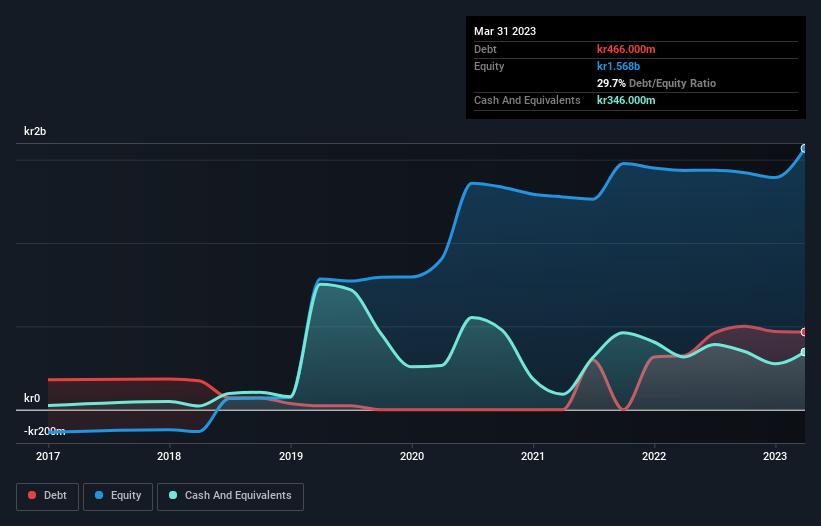
The image below, which you can click on for greater detail, shows that at March 2023 Ovzon had debt of kr466.0m, up from kr324.2m in one year. On the flip side, it has kr346.0m in cash leading to net debt of about kr120.0m.
A Look At Ovzon's Liabilities
We can see from the most recent balance sheet that Ovzon had liabilities of kr74.0m falling due within a year, and liabilities of kr474.0m due beyond that. Offsetting this, it had kr346.0m in cash and kr37.0m in receivables that were due within 12 months. So it has liabilities totalling kr165.0m more than its cash and near-term receivables, combined.
Given Ovzon has a market capitalization of kr1.65b, it's hard to believe these liabilities pose much threat. But there are sufficient liabilities that we would certainly recommend shareholders continue to monitor the balance sheet, going forward. When analysing debt levels, the balance sheet is the obvious place to start. But it is future earnings, more than anything, that will determine Ovzon's ability to maintain a healthy balance sheet going forward. So if you're focused on the future you can check out this free report showing analyst profit forecasts.
Over 12 months, Ovzon reported revenue of kr328m, which is a gain of 24%, although it did not report any earnings before interest and tax. Shareholders probably have their fingers crossed that it can grow its way to profits.
Caveat Emptor
Even though Ovzon managed to grow its top line quite deftly, the cold hard truth is that it is losing money on the EBIT line. To be specific the EBIT loss came in at kr114m. Considering that alongside the liabilities mentioned above does not give us much confidence that company should be using so much debt. Quite frankly we think the balance sheet is far from match-fit, although it could be improved with time. However, it doesn't help that it burned through kr302m of cash over the last year. So in short it's a really risky stock. There's no doubt that we learn most about debt from the balance sheet. But ultimately, every company can contain risks that exist outside of the balance sheet. Be aware that Ovzon is showing 2 warning signs in our investment analysis , and 1 of those is a bit unpleasant...
At the end of the day, it's often better to focus on companies that are free from net debt. You can access our special list of such companies (all with a track record of profit growth). It's free.
New: AI Stock Screener & Alerts
Our new AI Stock Screener scans the market every day to uncover opportunities.
• Dividend Powerhouses (3%+ Yield)
• Undervalued Small Caps with Insider Buying
• High growth Tech and AI Companies
Or build your own from over 50 metrics.
Have feedback on this article? Concerned about the content? Get in touch with us directly. Alternatively, email editorial-team (at) simplywallst.com.
This article by Simply Wall St is general in nature. We provide commentary based on historical data and analyst forecasts only using an unbiased methodology and our articles are not intended to be financial advice. It does not constitute a recommendation to buy or sell any stock, and does not take account of your objectives, or your financial situation. We aim to bring you long-term focused analysis driven by fundamental data. Note that our analysis may not factor in the latest price-sensitive company announcements or qualitative material. Simply Wall St has no position in any stocks mentioned.
About OM:OVZON
High growth potential and slightly overvalued.
Similar Companies
Market Insights

Community Narratives

