Is Smart Eye (STO:SEYE) Using Debt In A Risky Way?
David Iben put it well when he said, 'Volatility is not a risk we care about. What we care about is avoiding the permanent loss of capital.' So it might be obvious that you need to consider debt, when you think about how risky any given stock is, because too much debt can sink a company. As with many other companies Smart Eye AB (publ) (STO:SEYE) makes use of debt. But should shareholders be worried about its use of debt?
Why Does Debt Bring Risk?
Debt and other liabilities become risky for a business when it cannot easily fulfill those obligations, either with free cash flow or by raising capital at an attractive price. Ultimately, if the company can't fulfill its legal obligations to repay debt, shareholders could walk away with nothing. However, a more usual (but still expensive) situation is where a company must dilute shareholders at a cheap share price simply to get debt under control. Having said that, the most common situation is where a company manages its debt reasonably well - and to its own advantage. The first step when considering a company's debt levels is to consider its cash and debt together.
View our latest analysis for Smart Eye
What Is Smart Eye's Net Debt?
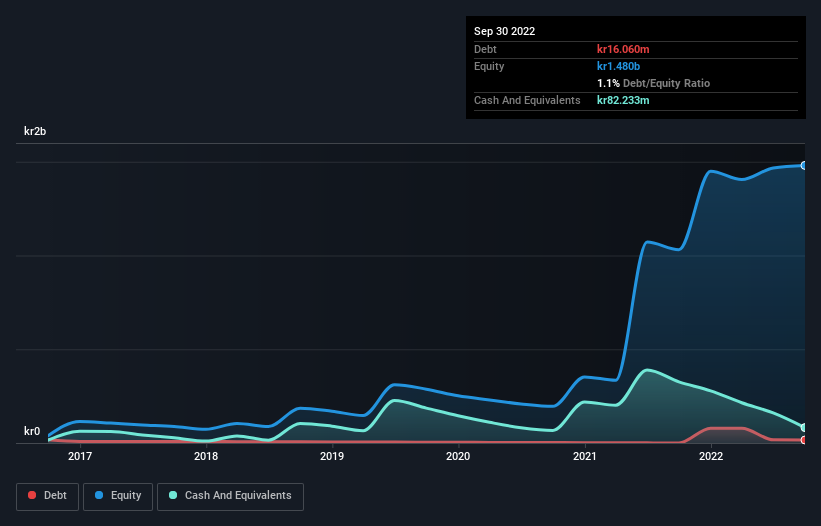
As you can see below, at the end of September 2022, Smart Eye had kr16.1m of debt, up from kr167.0k a year ago. Click the image for more detail. However, its balance sheet shows it holds kr82.2m in cash, so it actually has kr66.2m net cash.

How Healthy Is Smart Eye's Balance Sheet?
The latest balance sheet data shows that Smart Eye had liabilities of kr155.8m due within a year, and liabilities of kr159.4m falling due after that. Offsetting this, it had kr82.2m in cash and kr57.3m in receivables that were due within 12 months. So its liabilities outweigh the sum of its cash and (near-term) receivables by kr175.8m.
Given Smart Eye has a market capitalization of kr1.11b, it's hard to believe these liabilities pose much threat. Having said that, it's clear that we should continue to monitor its balance sheet, lest it change for the worse. Despite its noteworthy liabilities, Smart Eye boasts net cash, so it's fair to say it does not have a heavy debt load! When analysing debt levels, the balance sheet is the obvious place to start. But ultimately the future profitability of the business will decide if Smart Eye can strengthen its balance sheet over time. So if you're focused on the future you can check out this free report showing analyst profit forecasts.
In the last year Smart Eye wasn't profitable at an EBIT level, but managed to grow its revenue by 147%, to kr208m. So its pretty obvious shareholders are hoping for more growth!
So How Risky Is Smart Eye?
Statistically speaking companies that lose money are riskier than those that make money. And we do note that Smart Eye had an earnings before interest and tax (EBIT) loss, over the last year. Indeed, in that time it burnt through kr238m of cash and made a loss of kr286m. With only kr66.2m on the balance sheet, it would appear that its going to need to raise capital again soon. Importantly, Smart Eye's revenue growth is hot to trot. While unprofitable companies can be risky, they can also grow hard and fast in those pre-profit years. The balance sheet is clearly the area to focus on when you are analysing debt. However, not all investment risk resides within the balance sheet - far from it. We've identified 3 warning signs with Smart Eye (at least 2 which can't be ignored) , and understanding them should be part of your investment process.
If, after all that, you're more interested in a fast growing company with a rock-solid balance sheet, then check out our list of net cash growth stocks without delay.
New: Manage All Your Stock Portfolios in One Place
We've created the ultimate portfolio companion for stock investors, and it's free.
• Connect an unlimited number of Portfolios and see your total in one currency
• Be alerted to new Warning Signs or Risks via email or mobile
• Track the Fair Value of your stocks
Have feedback on this article? Concerned about the content? Get in touch with us directly. Alternatively, email editorial-team (at) simplywallst.com.
This article by Simply Wall St is general in nature. We provide commentary based on historical data and analyst forecasts only using an unbiased methodology and our articles are not intended to be financial advice. It does not constitute a recommendation to buy or sell any stock, and does not take account of your objectives, or your financial situation. We aim to bring you long-term focused analysis driven by fundamental data. Note that our analysis may not factor in the latest price-sensitive company announcements or qualitative material. Simply Wall St has no position in any stocks mentioned.
About OM:SEYE
Smart Eye
Develops human insight artificial intelligence (AI) technology solutions that understand, support, and predict human behavior in the Nordics countries, the rest of Europe, North America, Asia, and internationally.
High growth potential and fair value.
Similar Companies
Market Insights
Weekly Picks


Crazy Undervalued 42 Baggers Silver Play (Active & Running Mine)


Fiducian: Compliance Clouds or Value Opportunity?

Willamette Valley Vineyards (WVVI): Not-So-Great Value
Recently Updated Narratives
China Starch Holdings eyes a revenue growth of 4.66% with a 5-year strategic plan

PSIX The timing of insider sales is a serious question mark


The Great Strategy Swap – Selling "Old Auto" to Buy "Future Light"
Popular Narratives


MicroVision will explode future revenue by 380.37% with a vision towards success


NVDA: Expanding AI Demand Will Drive Major Data Center Investments Through 2026


