Advertisement
European Growth Companies Insiders Own With Up To 15% Revenue Growth

Simply Wall St
Reviewed by Simply Wall St

As European markets navigate a landscape of mixed economic signals, with the pan-European STOXX Europe 600 Index remaining relatively flat amid cautious optimism surrounding trade talks, investors are keenly observing growth opportunities. In this environment, companies that not only demonstrate robust revenue growth but also have significant insider ownership can be particularly appealing, as they suggest confidence from those closest to the business.
Top 10 Growth Companies With High Insider Ownership In Europe
| Name | Insider Ownership | Earnings Growth |
| Xbrane Biopharma (OM:XBRANE) | 21.8% | 56.8% |
| Pharma Mar (BME:PHM) | 11.8% | 43.3% |
| MedinCell (ENXTPA:MEDCL) | 13.9% | 130.8% |
| Marinomed Biotech (WBAG:MARI) | 29.7% | 20.2% |
| KebNi (OM:KEBNI B) | 38.3% | 94.5% |
| Elliptic Laboratories (OB:ELABS) | 24.4% | 79% |
| CTT Systems (OM:CTT) | 17.5% | 37.9% |
| Circus (XTRA:CA1) | 24.7% | 94.8% |
| Bonesupport Holding (OM:BONEX) | 10.4% | 62.3% |
| Bergen Carbon Solutions (OB:BCS) | 12% | 63.2% |
Let's dive into some prime choices out of the screener.
Moltiply Group (BIT:MOL)
Simply Wall St Growth Rating: ★★★★★☆
Overview: Moltiply Group S.p.A. is a holding company operating in the financial services industry with a market capitalization of €1.70 billion.
Operations: Moltiply Group S.p.A. generates revenue through its Mavriq Division, which contributes €236.92 million, and the Moltiply BPO&Tech segment, which accounts for €243.86 million.
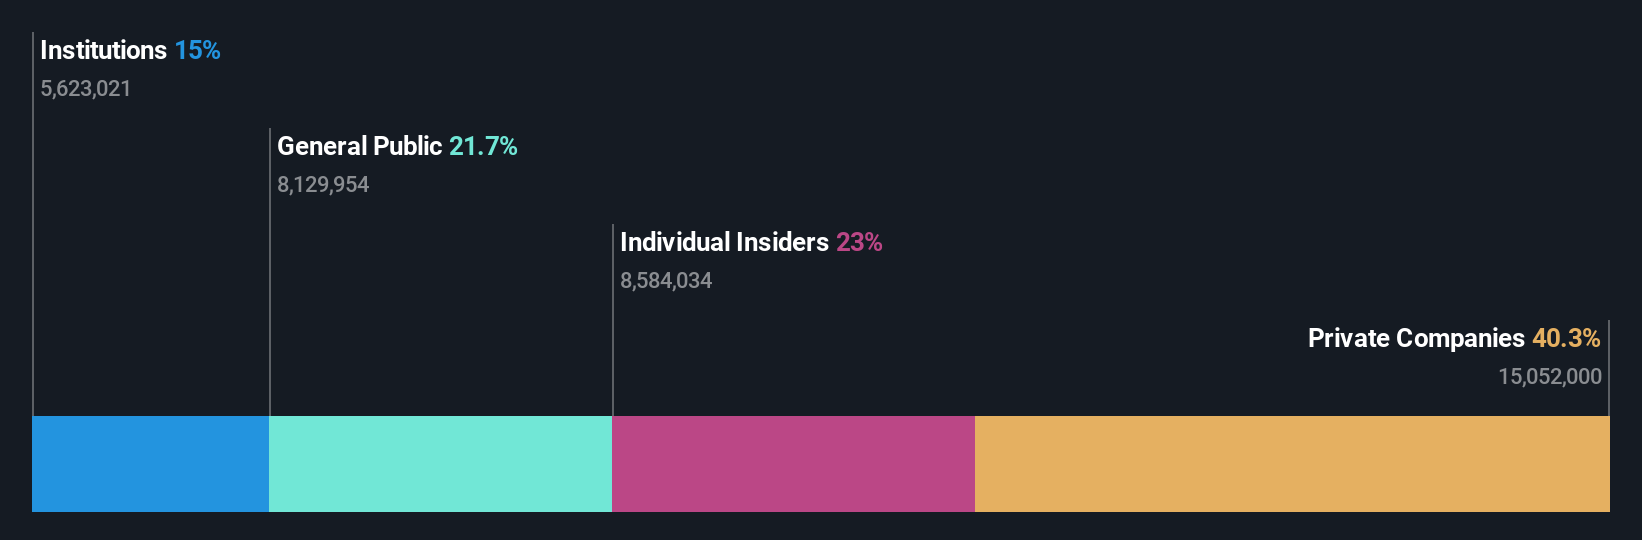
Insider Ownership: 23%
Revenue Growth Forecast: 15.6% p.a.
Moltiply Group shows promising growth prospects with forecasted earnings growth of 27.1% per year, outpacing the Italian market's 7.5%. Despite its revenue growth being slower than 20% annually, it still surpasses the local market average of 4.3%. Analysts agree on a potential stock price increase of 26.3%. Recent Q1 results revealed sales of €136.55 million and net income of €11.58 million, indicating steady financial performance amidst no significant insider trading activity recently noted.
- Dive into the specifics of Moltiply Group here with our thorough growth forecast report.
- Insights from our recent valuation report point to the potential overvaluation of Moltiply Group shares in the market.
Hanza (OM:HANZA)
Simply Wall St Growth Rating: ★★★★☆☆
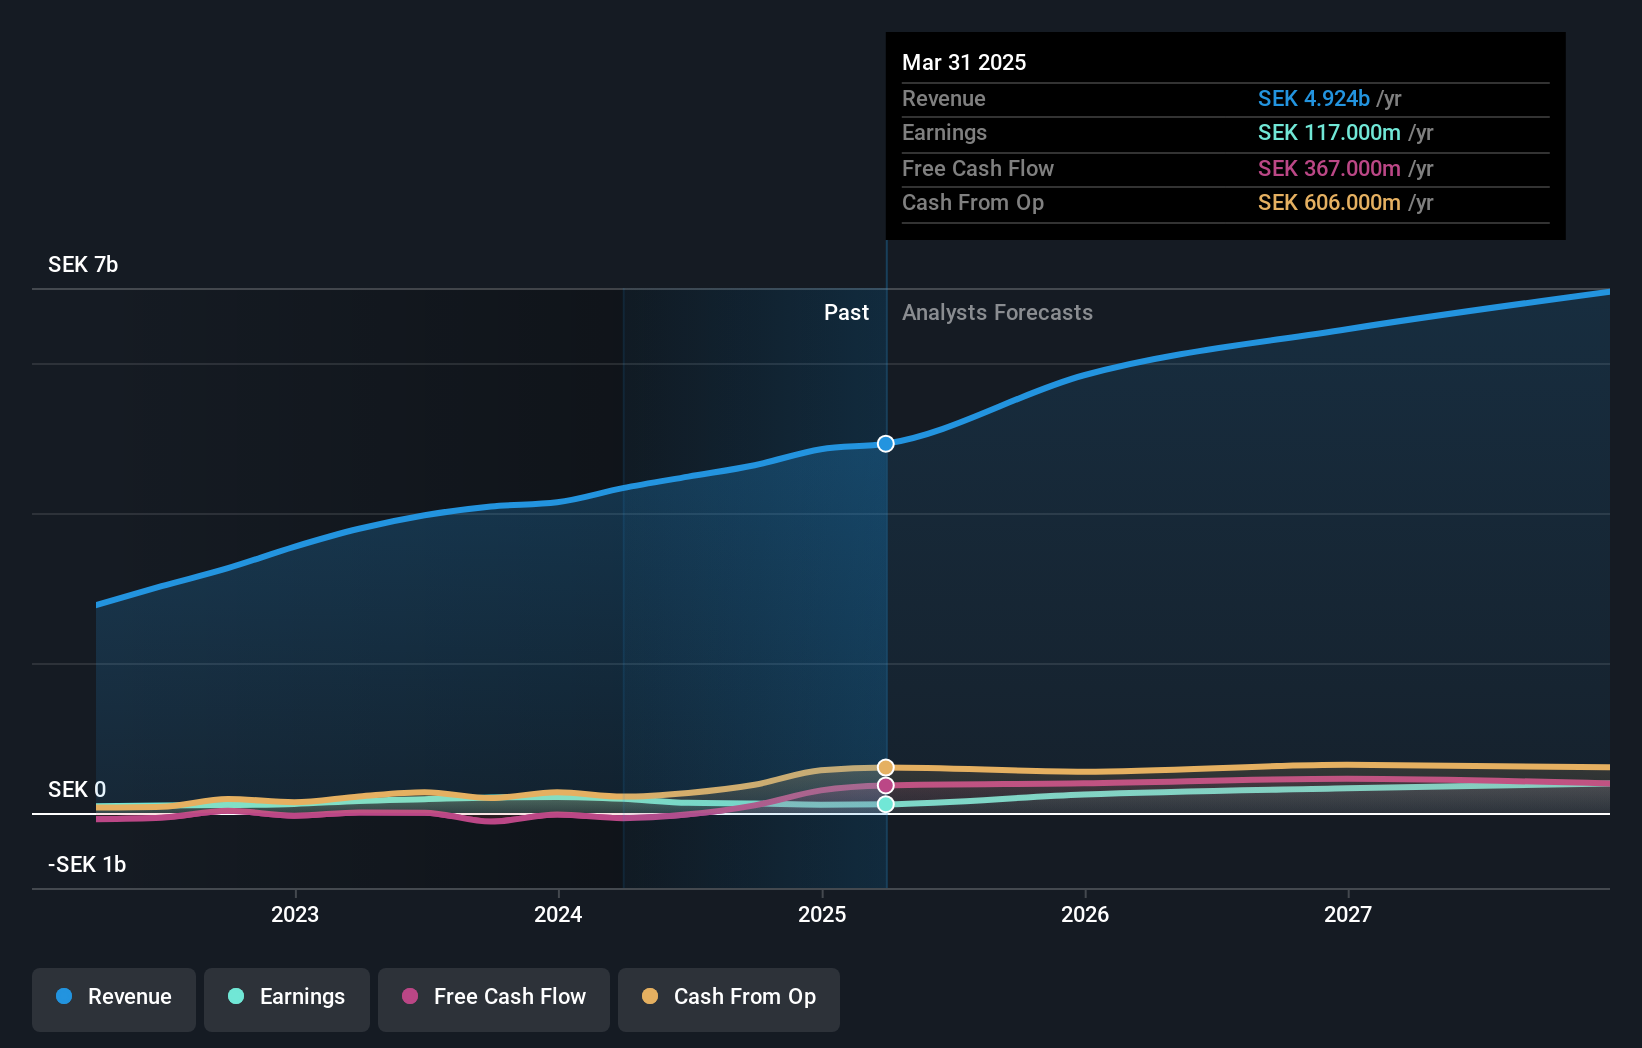
Overview: Hanza AB (publ) offers manufacturing solutions and has a market cap of SEK 4.96 billion.
Operations: The company's revenue segments include Electronics SEK 1.85 billion, Mechanics SEK 1.73 billion, and Other Segments SEK 0.42 billion.
Insider Ownership: 34.8%
Revenue Growth Forecast: 12.6% p.a.
Hanza AB demonstrates strong growth potential, with earnings expected to rise significantly at 33.9% annually, surpassing the Swedish market's average. Despite trading well below its estimated fair value, interest payments are not adequately covered by earnings. Recent Q2 results showed a substantial increase in net income to SEK 52 million from SEK 6 million year-on-year. Insider activity indicates more buying than selling recently, albeit not in large volumes, reflecting confidence in future prospects.
- Navigate through the intricacies of Hanza with our comprehensive analyst estimates report here.
- Our valuation report unveils the possibility Hanza's shares may be trading at a discount.
HMS Networks (OM:HMS)
Simply Wall St Growth Rating: ★★★★☆☆
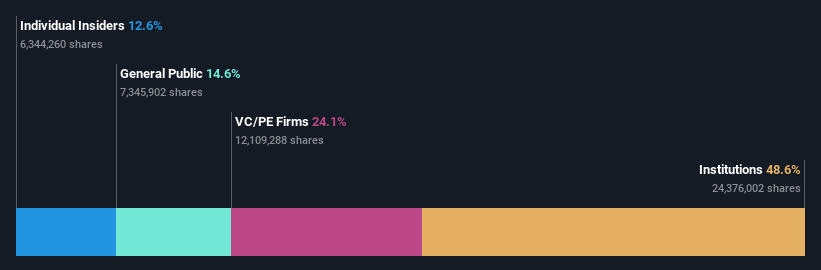
Overview: HMS Networks AB (publ) provides products that facilitate communication and information sharing for industrial equipment globally, with a market cap of SEK20.94 billion.
Operations: HMS Networks generates revenue through its products that enable industrial equipment to communicate and share information globally.
Insider Ownership: 12.3%
Revenue Growth Forecast: 14.2% p.a.
HMS Networks shows promising growth potential with earnings forecasted to grow significantly at 33.5% annually, outpacing the Swedish market. Despite trading slightly below its estimated fair value, it carries a high level of debt which may be concerning. Recent Q2 results revealed a substantial increase in net income to SEK 84 million from SEK 34 million year-on-year. Insider activity indicates more buying than selling recently, suggesting confidence in the company's future trajectory.
- Click here and access our complete growth analysis report to understand the dynamics of HMS Networks.
- According our valuation report, there's an indication that HMS Networks' share price might be on the expensive side.
Make It Happen
- Embark on your investment journey to our 214 Fast Growing European Companies With High Insider Ownership selection here.
- Contemplating Other Strategies? Diversify your portfolio with solid dividend payers offering reliable income streams to weather potential market turbulence.
This article by Simply Wall St is general in nature. We provide commentary based on historical data and analyst forecasts only using an unbiased methodology and our articles are not intended to be financial advice. It does not constitute a recommendation to buy or sell any stock, and does not take account of your objectives, or your financial situation. We aim to bring you long-term focused analysis driven by fundamental data. Note that our analysis may not factor in the latest price-sensitive company announcements or qualitative material. Simply Wall St has no position in any stocks mentioned.The analysis only considers stock directly held by insiders. It does not include indirectly owned stock through other vehicles such as corporate and/or trust entities. All forecast revenue and earnings growth rates quoted are in terms of annualised (per annum) growth rates over 1-3 years.
Valuation is complex, but we're here to simplify it.
Discover if Hanza might be undervalued or overvalued with our detailed analysis, featuring fair value estimates, potential risks, dividends, insider trades, and its financial condition.
Access Free AnalysisHave feedback on this article? Concerned about the content? Get in touch with us directly. Alternatively, email editorial-team@simplywallst.com
About OM:HANZA
Good value with reasonable growth potential.
Similar Companies
Market Insights


Advertisement
Community Narratives
Pole position to benefit from GENIUS Act
Fair Value US$233.04|58.8% undervalued
CH
Community Contributor
IREN will transform from bitcoin miner to leader in AI infrastructure
Fair Value US$21.48|17.5% undervalued
KA
Community Contributor
Behind the Assay: XRF Scientific’s Role in Modern Mining Economics
Fair Value AU$2.10|2.4% undervalued
RO
Community Contributor