
Some say volatility, rather than debt, is the best way to think about risk as an investor, but Warren Buffett famously said that 'Volatility is far from synonymous with risk.' When we think about how risky a company is, we always like to look at its use of debt, since debt overload can lead to ruin. As with many other companies ZignSec AB (publ) (STO:ZIGN) makes use of debt. But the more important question is: how much risk is that debt creating?
What Risk Does Debt Bring?
Debt assists a business until the business has trouble paying it off, either with new capital or with free cash flow. In the worst case scenario, a company can go bankrupt if it cannot pay its creditors. However, a more frequent (but still costly) occurrence is where a company must issue shares at bargain-basement prices, permanently diluting shareholders, just to shore up its balance sheet. Of course, the upside of debt is that it often represents cheap capital, especially when it replaces dilution in a company with the ability to reinvest at high rates of return. When we think about a company's use of debt, we first look at cash and debt together.
Check out our latest analysis for ZignSec
How Much Debt Does ZignSec Carry?
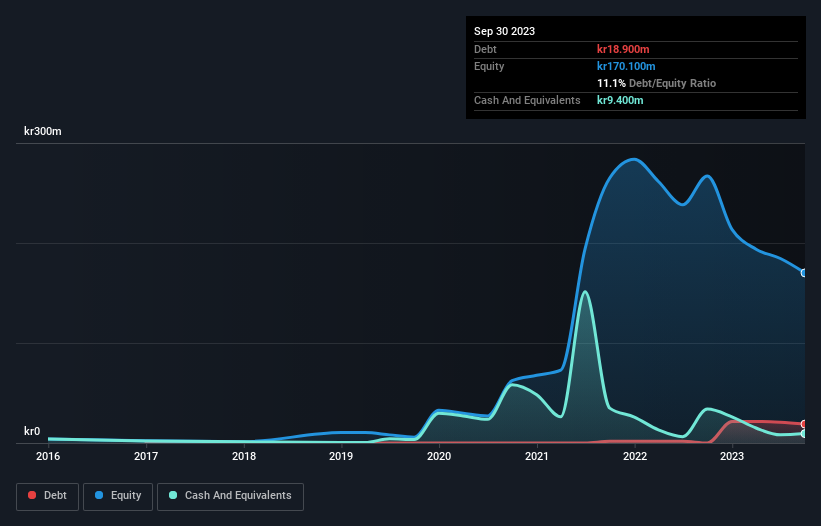
You can click the graphic below for the historical numbers, but it shows that as of September 2023 ZignSec had kr18.9m of debt, an increase on none, over one year. On the flip side, it has kr9.40m in cash leading to net debt of about kr9.50m.
A Look At ZignSec's Liabilities
The latest balance sheet data shows that ZignSec had liabilities of kr35.6m due within a year, and liabilities of kr15.5m falling due after that. On the other hand, it had cash of kr9.40m and kr23.5m worth of receivables due within a year. So its liabilities outweigh the sum of its cash and (near-term) receivables by kr18.2m.
This deficit isn't so bad because ZignSec is worth kr59.4m, and thus could probably raise enough capital to shore up its balance sheet, if the need arose. But we definitely want to keep our eyes open to indications that its debt is bringing too much risk. There's no doubt that we learn most about debt from the balance sheet. But it is ZignSec's earnings that will influence how the balance sheet holds up in the future. So if you're keen to discover more about its earnings, it might be worth checking out this graph of its long term earnings trend.
Over 12 months, ZignSec made a loss at the EBIT level, and saw its revenue drop to kr86m, which is a fall of 6.0%. That's not what we would hope to see.
Caveat Emptor
Over the last twelve months ZignSec produced an earnings before interest and tax (EBIT) loss. Its EBIT loss was a whopping kr96m. Considering that alongside the liabilities mentioned above does not give us much confidence that company should be using so much debt. Quite frankly we think the balance sheet is far from match-fit, although it could be improved with time. However, it doesn't help that it burned through kr26m of cash over the last year. So suffice it to say we consider the stock very risky. When analysing debt levels, the balance sheet is the obvious place to start. But ultimately, every company can contain risks that exist outside of the balance sheet. To that end, you should learn about the 5 warning signs we've spotted with ZignSec (including 4 which are a bit concerning) .
At the end of the day, it's often better to focus on companies that are free from net debt. You can access our special list of such companies (all with a track record of profit growth). It's free.
The New Payments ETF Is Live on NASDAQ:
Money is moving to real-time rails, and a newly listed ETF now gives investors direct exposure. Fast settlement. Institutional custody. Simple access.
Explore how this launch could reshape portfolios
Sponsored ContentValuation is complex, but we're here to simplify it.
Discover if ZignSec might be undervalued or overvalued with our detailed analysis, featuring fair value estimates, potential risks, dividends, insider trades, and its financial condition.
Access Free AnalysisHave feedback on this article? Concerned about the content? Get in touch with us directly. Alternatively, email editorial-team (at) simplywallst.com.
This article by Simply Wall St is general in nature. We provide commentary based on historical data and analyst forecasts only using an unbiased methodology and our articles are not intended to be financial advice. It does not constitute a recommendation to buy or sell any stock, and does not take account of your objectives, or your financial situation. We aim to bring you long-term focused analysis driven by fundamental data. Note that our analysis may not factor in the latest price-sensitive company announcements or qualitative material. Simply Wall St has no position in any stocks mentioned.
About OM:ZIGN
ZignSec
Provides Software as a Service platform with digital real time solutions for customers due diligence and identity verification worldwide.
Excellent balance sheet low.
Similar Companies
Market Insights

Weekly Picks

THE KINGDOM OF BROWN GOODS: WHY MGPI IS BEING CRUSHED BY INVENTORY & PRIMED FOR RESURRECTION


Why Vertical Aerospace (NYSE: EVTL) is Worth Possibly Over 13x its Current Price


The Quiet Giant That Became AI’s Power Grid
Recently Updated Narratives


Keppel DC REIT (SGX: AJBU) is a resilient gem in the data center space.
Why Vertical Aerospace (NYSE: EVTL) is Worth Possibly Over 13x its Current Price

Deep Value Multi Bagger Opportunity
Popular Narratives

MicroVision will explode future revenue by 380.37% with a vision towards success


Crazy Undervalued 42 Baggers Silver Play (Active & Running Mine)


