
Advertisement
Getting In Cheap On Checkin.Com Group AB (publ) (STO:CHECK) Might Be Difficult
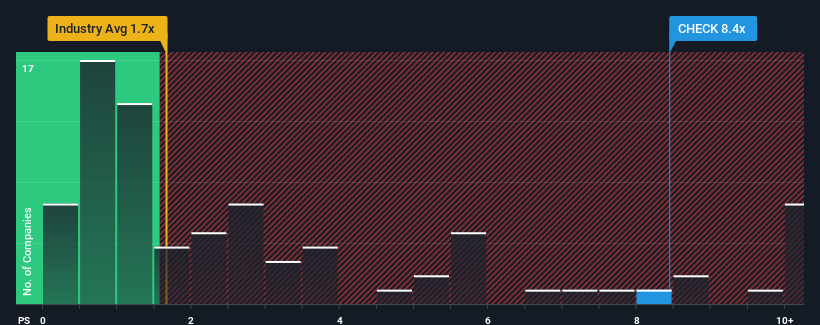
Checkin.Com Group AB (publ)'s (STO:CHECK) price-to-sales (or "P/S") ratio of 8.4x may look like a poor investment opportunity when you consider close to half the companies in the Software industry in Sweden have P/S ratios below 1.7x. However, the P/S might be quite high for a reason and it requires further investigation to determine if it's justified.
Check out our latest analysis for Checkin.Com Group
What Does Checkin.Com Group's P/S Mean For Shareholders?
With revenue growth that's superior to most other companies of late, Checkin.Com Group has been doing relatively well. The P/S is probably high because investors think this strong revenue performance will continue. However, if this isn't the case, investors might get caught out paying too much for the stock.
Keen to find out how analysts think Checkin.Com Group's future stacks up against the industry? In that case, our free report is a great place to start.What Are Revenue Growth Metrics Telling Us About The High P/S?
In order to justify its P/S ratio, Checkin.Com Group would need to produce outstanding growth that's well in excess of the industry.
Taking a look back first, we see that the company grew revenue by an impressive 28% last year. The latest three year period has also seen an incredible overall rise in revenue, aided by its incredible short-term performance. Accordingly, shareholders would have been over the moon with those medium-term rates of revenue growth.
Turning to the outlook, the next year should generate growth of 84% as estimated by the one analyst watching the company. Meanwhile, the rest of the industry is forecast to only expand by 15%, which is noticeably less attractive.
With this in mind, it's not hard to understand why Checkin.Com Group's P/S is high relative to its industry peers. Apparently shareholders aren't keen to offload something that is potentially eyeing a more prosperous future.
The Key Takeaway
While the price-to-sales ratio shouldn't be the defining factor in whether you buy a stock or not, it's quite a capable barometer of revenue expectations.
Our look into Checkin.Com Group shows that its P/S ratio remains high on the merit of its strong future revenues. At this stage investors feel the potential for a deterioration in revenues is quite remote, justifying the elevated P/S ratio. Unless these conditions change, they will continue to provide strong support to the share price.
We don't want to rain on the parade too much, but we did also find 1 warning sign for Checkin.Com Group that you need to be mindful of.
Of course, profitable companies with a history of great earnings growth are generally safer bets. So you may wish to see this free collection of other companies that have reasonable P/E ratios and have grown earnings strongly.
New: AI Stock Screener & Alerts
Our new AI Stock Screener scans the market every day to uncover opportunities.
• Dividend Powerhouses (3%+ Yield)
• Undervalued Small Caps with Insider Buying
• High growth Tech and AI Companies
Or build your own from over 50 metrics.
Have feedback on this article? Concerned about the content? Get in touch with us directly. Alternatively, email editorial-team (at) simplywallst.com.
This article by Simply Wall St is general in nature. We provide commentary based on historical data and analyst forecasts only using an unbiased methodology and our articles are not intended to be financial advice. It does not constitute a recommendation to buy or sell any stock, and does not take account of your objectives, or your financial situation. We aim to bring you long-term focused analysis driven by fundamental data. Note that our analysis may not factor in the latest price-sensitive company announcements or qualitative material. Simply Wall St has no position in any stocks mentioned.
About OM:CHECK
Checkin.Com Group
Develops software as a service that allow its consumers to connect with brands and services online in Sweden and internationally.
Excellent balance sheet and good value.
Market Insights

Advertisement
Community Narratives
Quality at a Premium. A time to watch, not to buy?
Fair Value US$154.56|29.9% undervalued
DA
Community Contributor
GRAB: The Super-App at the Heart of Southeast Asia’s Digital Boom
Fair Value US$8.20|22.9% undervalued
BL
Community Contributor
Verve Group to Surge with 51.61% Revenue Growth
Fair Value €6.00|64.1% undervalued
ME
Community Contributor